

Question: My data was the two quantitative variables found by gapminder.org: smoking men as my independent (x) variable and lung cancer death rate per 100K as
My data was the two quantitative variables found by gapminder.org: smoking men as my independent (x) variable and lung cancer death rate per 100K as my dependent (y) variable randomly chosen from 35 countries.Since the P-value is .012 and significance level is 0.05, we can conclude that the null hypothesis is rejected, there is sufficient evidence to support the claim that a linear relationship exists between smoking and lung cancer death rate (Table B). All graphs and tables are attached.
How did you think your explanatory variable would effect your response variable?Why did you think this?("Because that is the way it looked on Gapminder" is not a valid answer!)Why do you think it did or did not turn out like you expected?Do you think there was anyconfoundingorcommon responsegoing on? Explain it.
Watch the video link:
https://www.youtube.com/watch?v=u4L130DkdOw
Give a brief summary of the video above? Why do you think what Anna was saying is important for us to keep this in mind when we are looking at a single data value for a country? (Take a look at Dollar Street which is also on gapminder.org.
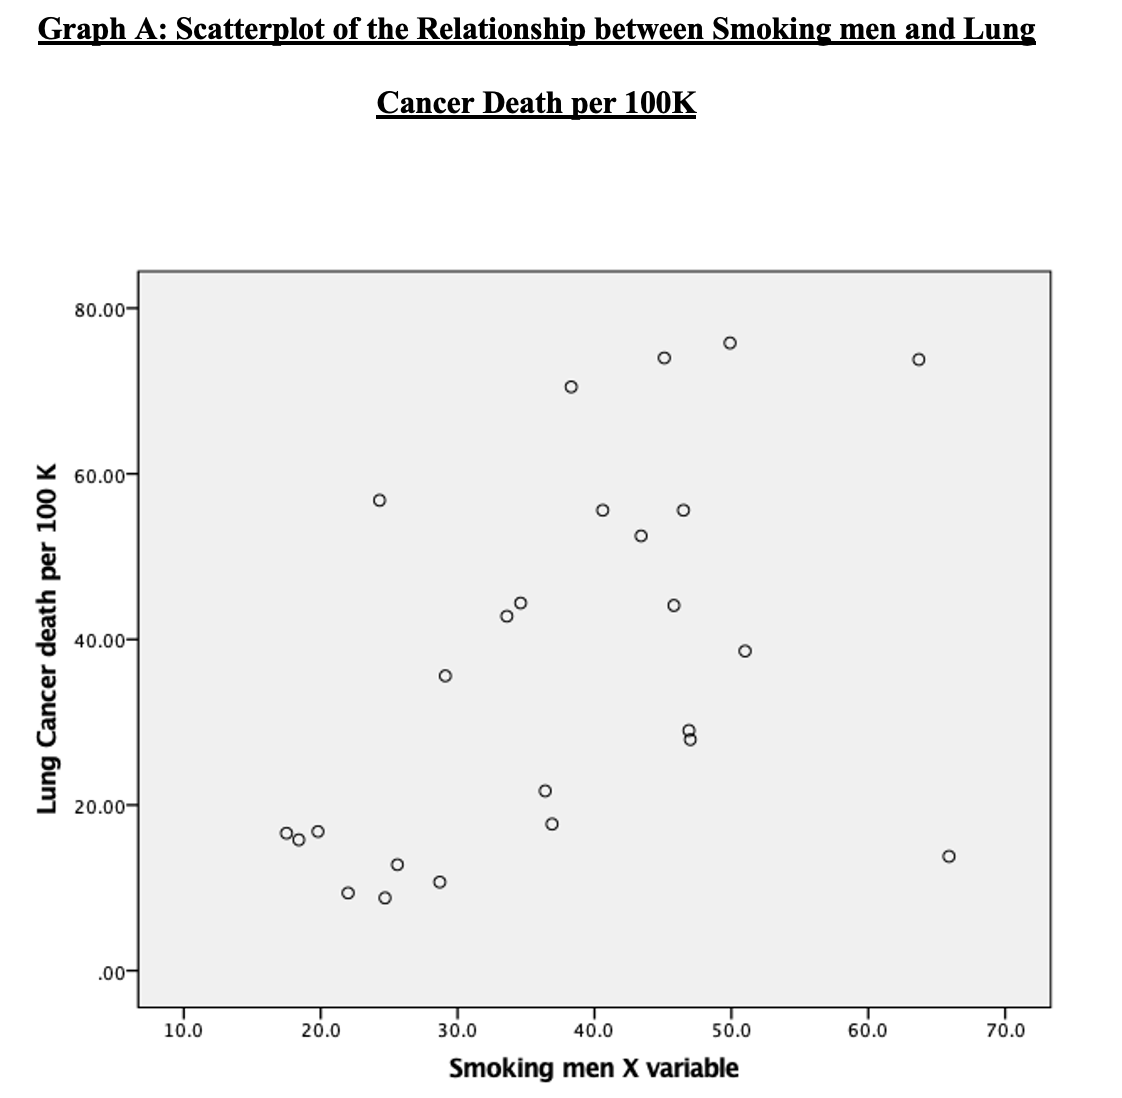
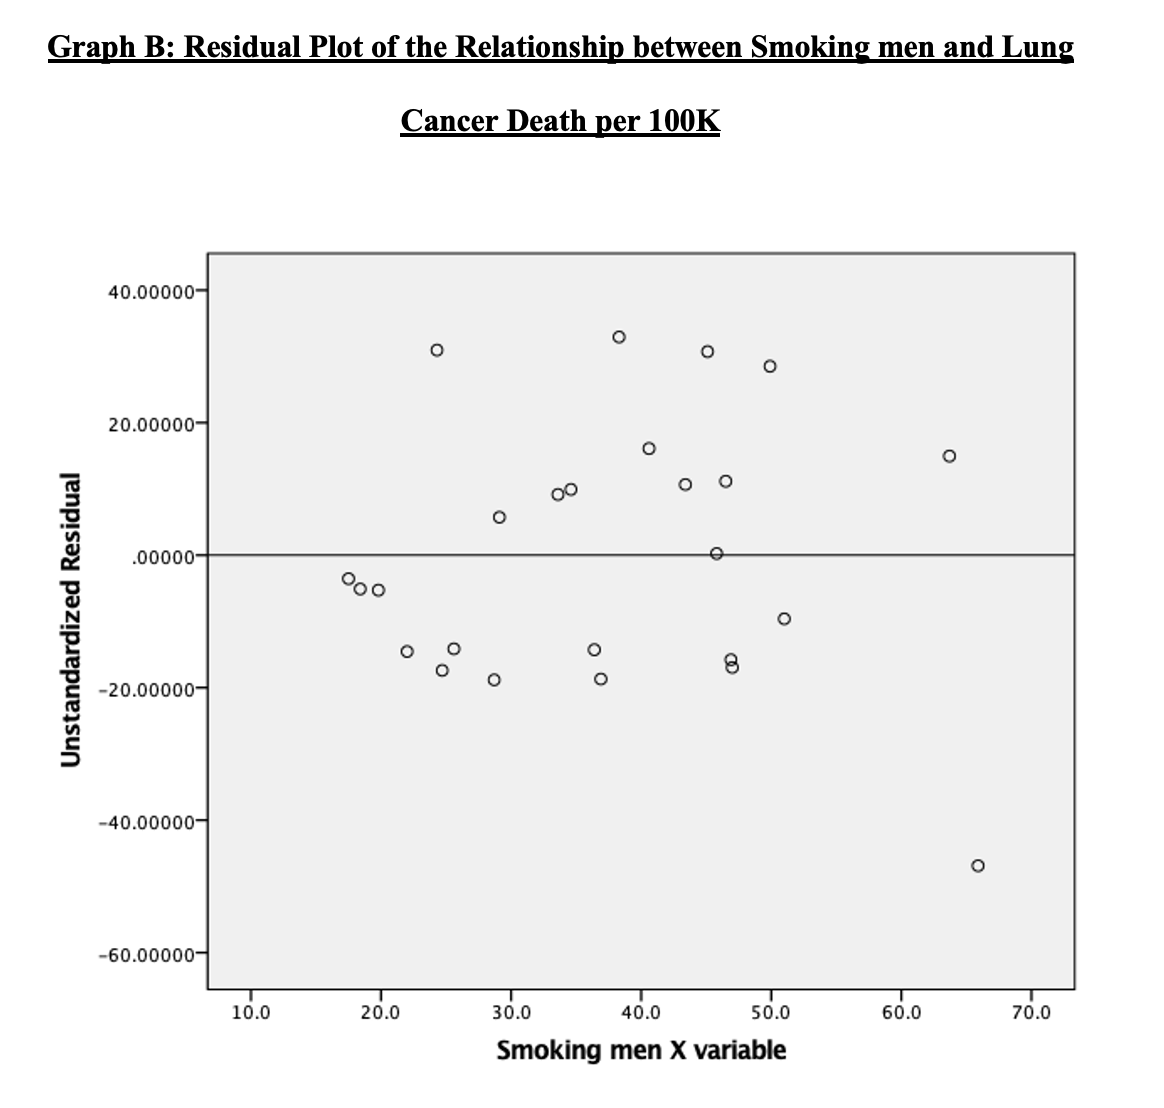
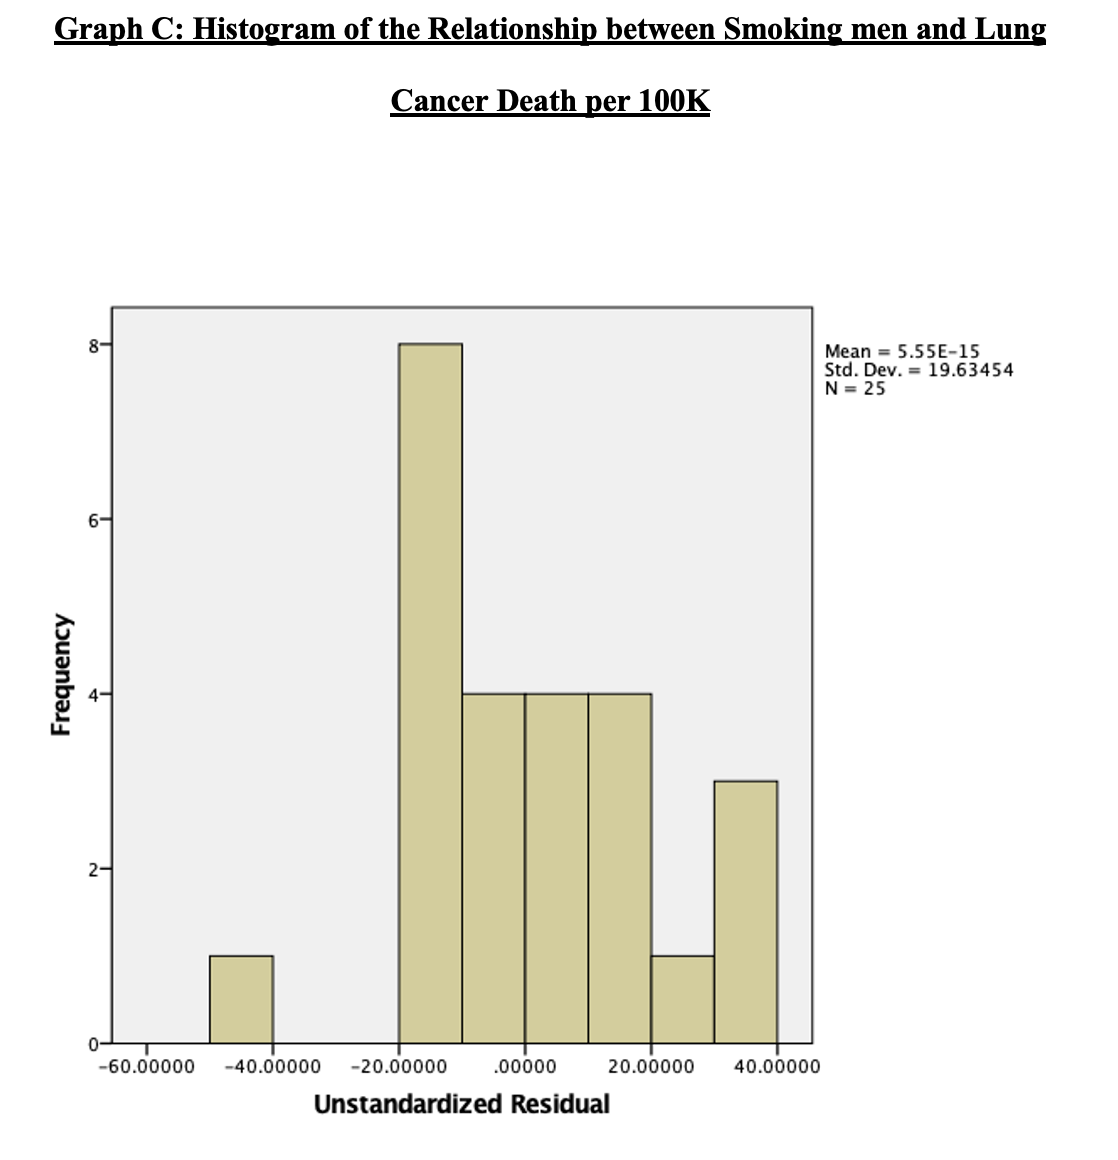
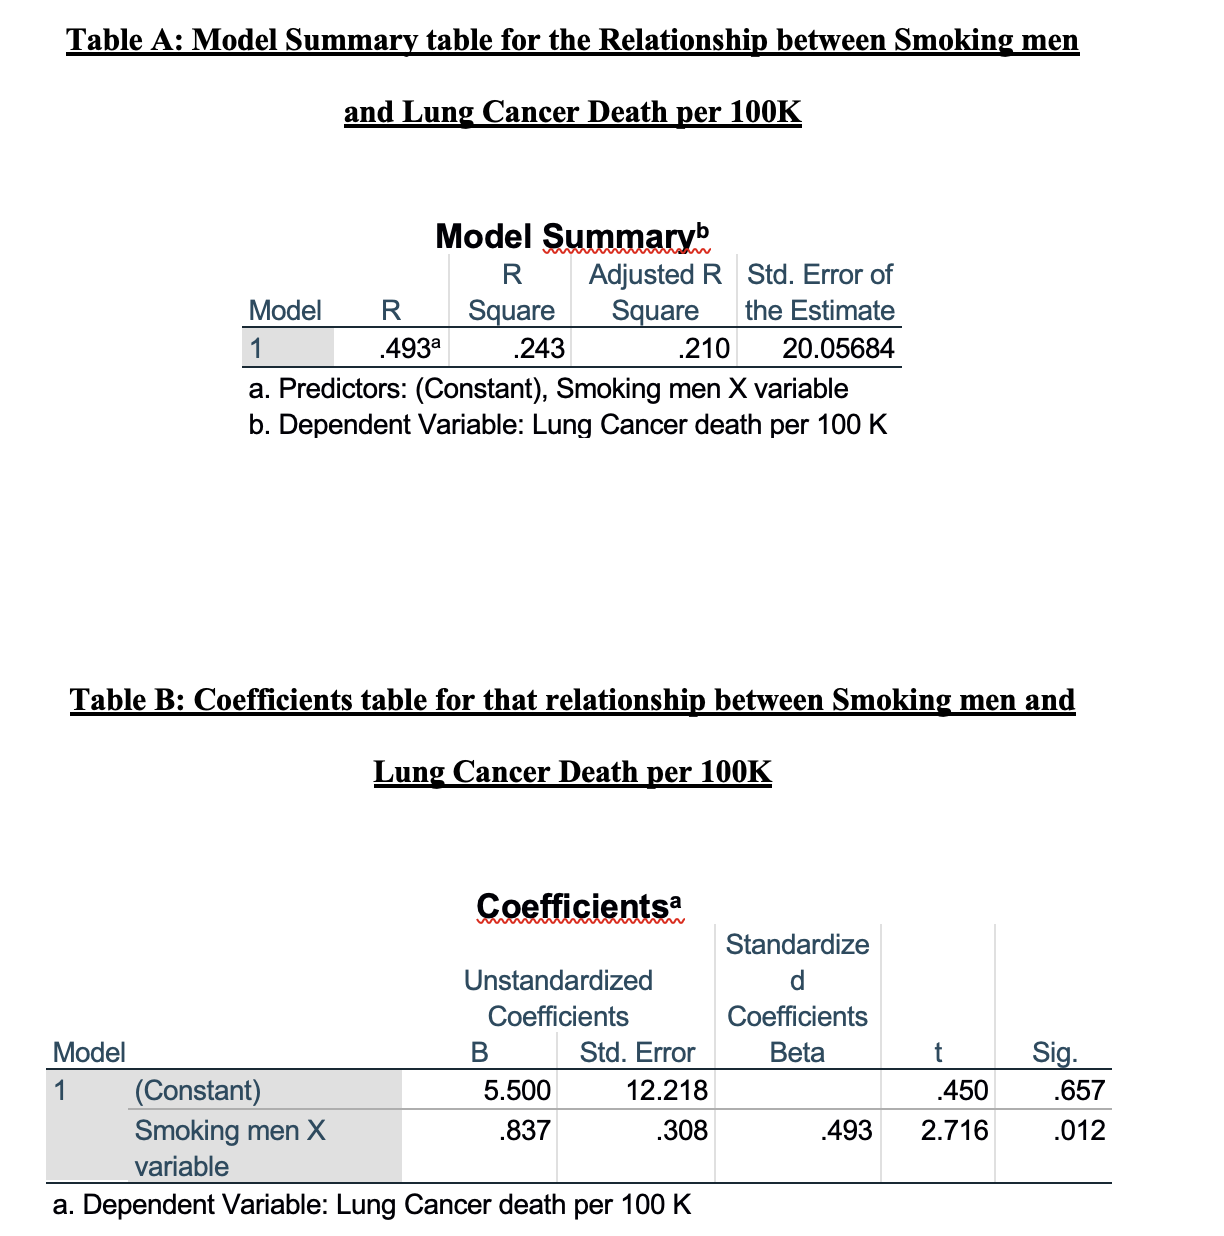
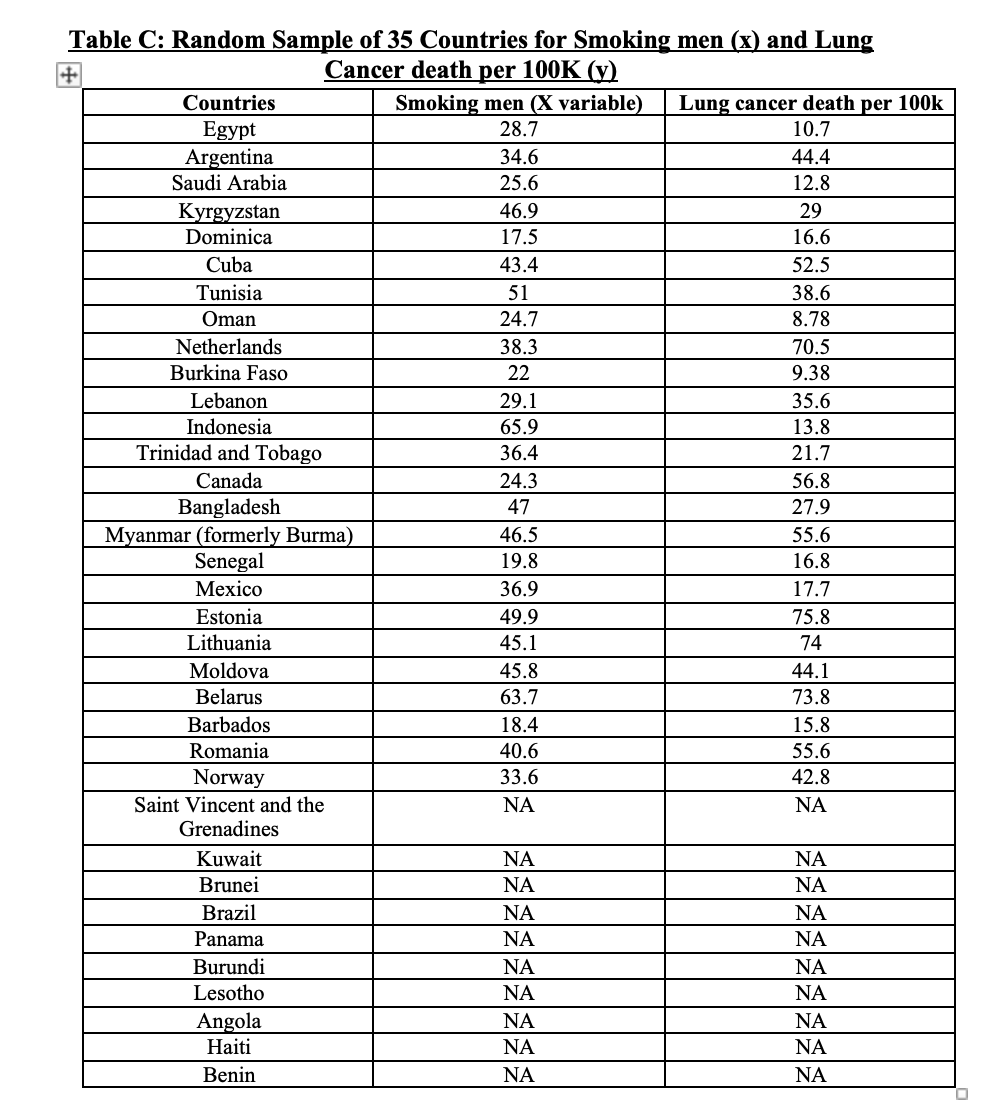
Graph A: Scattemlot of the Relationship between Smoking men and Lung Cancer Death per 100K Lung Cancer death per 100 K 10.0 20.0 30.0 40.0 50.0 60.0 70.0 Smoking men X variable Graph B: Residual Plot of the Relationship between Smoking men and Lung Cancer Death per 100K 40.00000- O O O O 20.00000- O O OO O O O .00000- Ooo Unstandardized Residual O o o 8 -20.00000- O -40.00000- O -60.00000- 10.0 20.0 30.0 40.0 50.0 60.0 70.0 Smoking men X variableGraph C: Histogram of the Relationship between Smoking men and Lung Cancer Death per 100K Mean - 5.55E15 Std. Dev. - 19.63454 N I 25 40.00000 40.00000 -20.00000 .00000 20.00000 40.00000 Unstandardlzed Residual Table A: Model Summary table for the Relationship between Smoking men and Lung Cancer Death per 100K Model Summaryb R Adjusted R Std. Error of Model R Square Square the Estimate 493 243 210 20.05684 a. Predictors: (Constant), Smoking men X variable b. Dependent Variable: Lung Cancer death per 100 K Table B: Coefficients table for that relationship between Smoking men and Lung Cancer Death per 100K Coefficientsa Standardize Unstandardized d Coefficients Coefficients Model B Std. Error Beta Sig. 1 (Constant) 5.500 12.218 450 657 Smoking men X .837 308 493 2.716 012 variable a. Dependent Variable: Lung Cancer death per 100 KTable C: Random Sample of 35 Countries for Smoking men (x) and Lung Cancer death per 100K (y) Countries Smoking men (X variable) Lung cancer death per 100k Egypt 28.7 10.7 Argentina 34.6 44.4 Saudi Arabia 25.6 12.8 Kyrgyzstan 46.9 29 Dominica 17.5 16.6 Cuba 43.4 52.5 Tunisia 51 38.6 Oman 24.7 BL'8 Netherlands 38.3 70.5 Burkina Faso 22 9.38 Lebanon 29.1 35.6 Indonesia 65.9 13.8 Trinidad and Tobago 36.4 21.7 Canada 24.3 56.8 Bangladesh 47 27.9 Myanmar (formerly Burma) 46.5 55.6 Senegal 16.8 Mexico 36.9 17.7 Estonia 49.9 75.8 Lithuania 15.1 74 Moldova 45.8 44.1 Belarus 63.7 73.8 Barbados 18.4 15.8 Romania 40.6 55.6 Norway 33.6 42.8 Saint Vincent and the NA NA Grenadines Kuwait NA NA Brune NA NA Brazil NA NA Panama NA NA Burundi NA NA Lesotho NA NA Angola NA NA Haiti NA NA Benin NA NA
Step by Step Solution
There are 3 Steps involved in it

Get step-by-step solutions from verified subject matter experts