

Question: My Excel Box Plot and Whisker Chart are showing the incorrect value of Quartile 1 (Q1) and Quartile 3 (Q3). My Q1 is 480 and
My Excel Box Plot and Whisker Chart are showing the incorrect value of Quartile 1 (Q1) and Quartile 3 (Q3). My Q1 is 480 and Q3 is 670 but the chart shows it as 337 and 812. Fix this.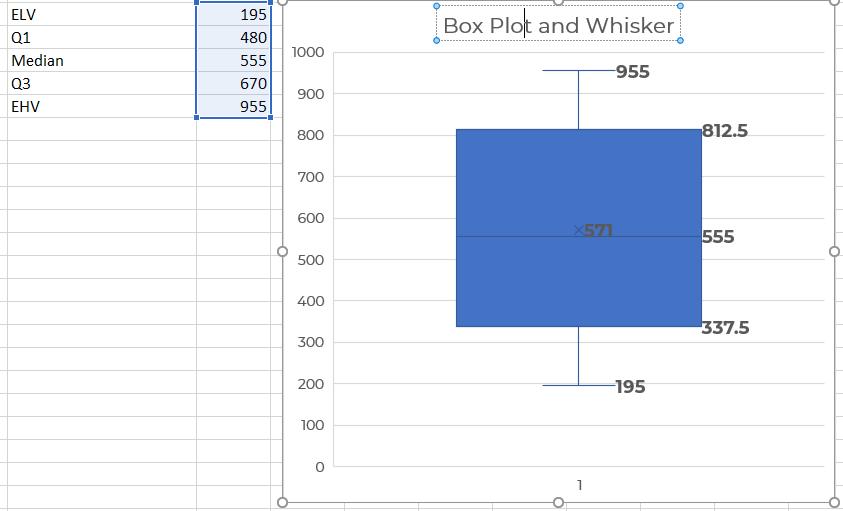
ELV 195 Box Plot and Whisker Q1 480 1000 Median 555 -955 Q3 670 900 EHV 955 800 812.5 700 600 X571 555 500 400 337.5 300 200 -195 100
Step by Step Solution
★★★★★
3.33 Rating (156 Votes )
There are 3 Steps involved in it
1 Expert Approved Answer
Step: 1 Unlock

First the Median is arrived at by adding the Q1... View full answer
Question Has Been Solved by an Expert!
Get step-by-step solutions from verified subject matter experts
Step: 2 Unlock
Step: 3 Unlock