

Question: My issue is how to create the scatterplot and equations fA B C D F F 27 Walton 5487 12611 G 124 18222 28 Columbia
My issue is how to create the scatterplot and equations
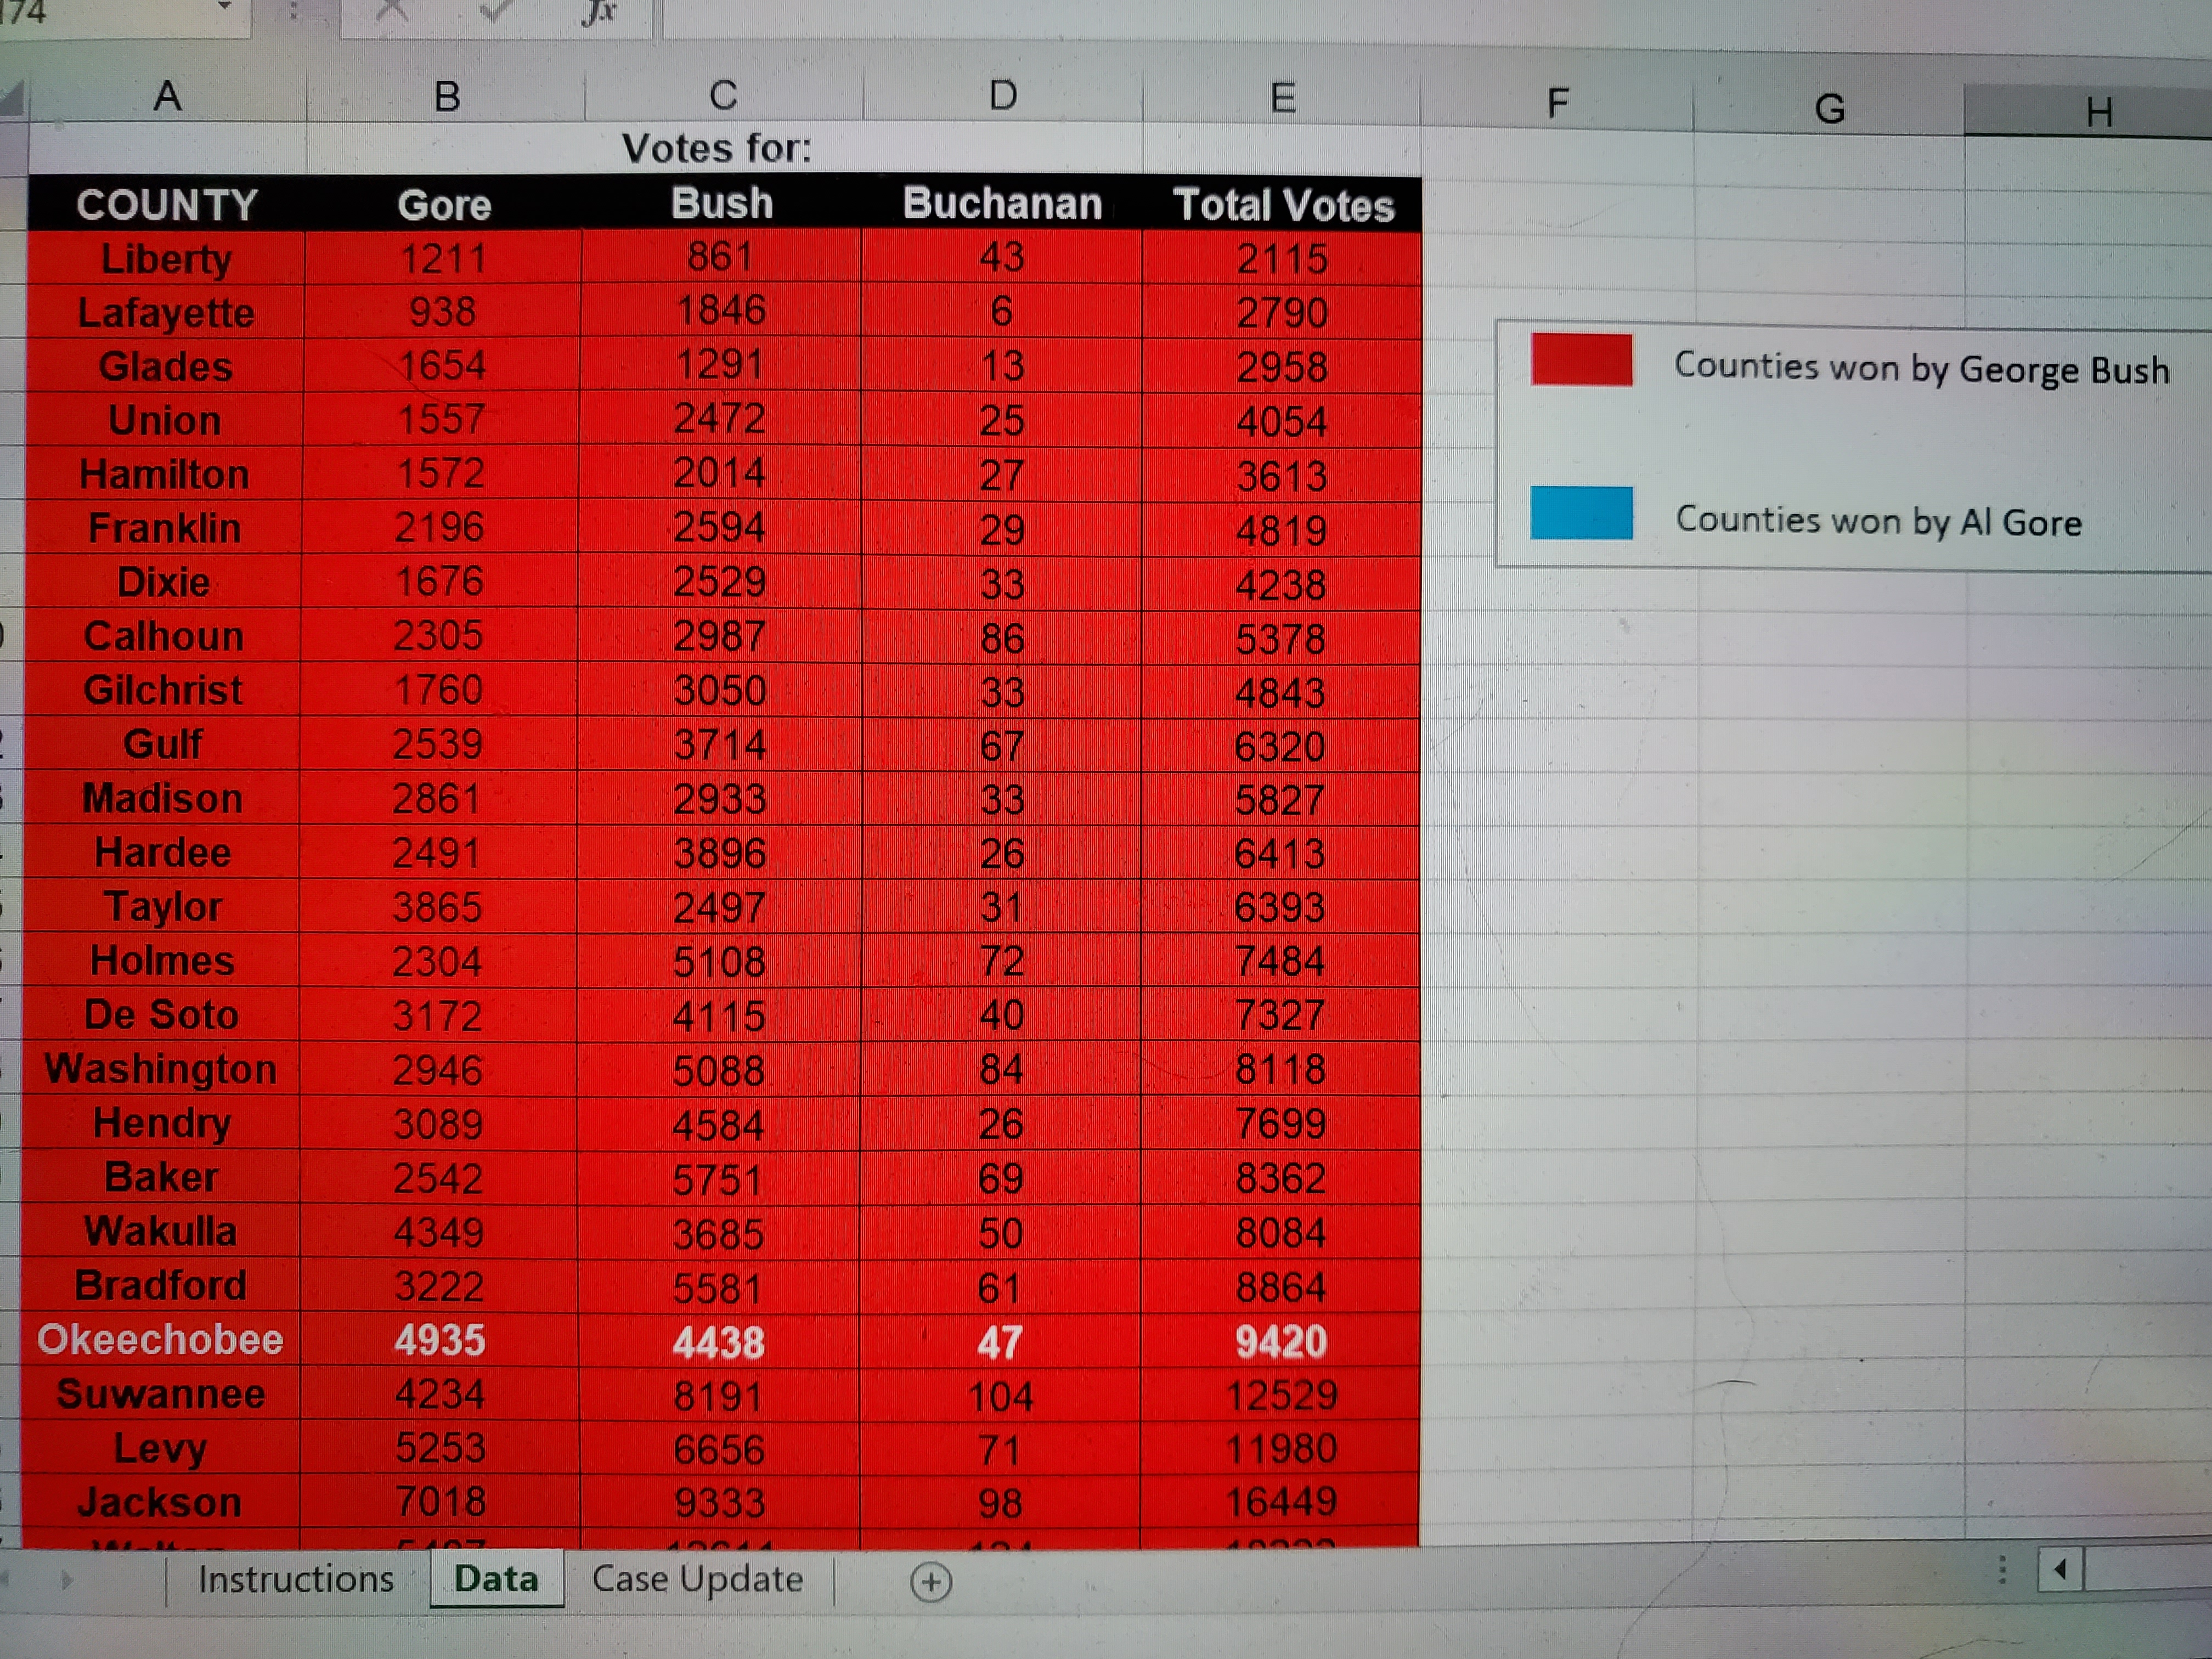
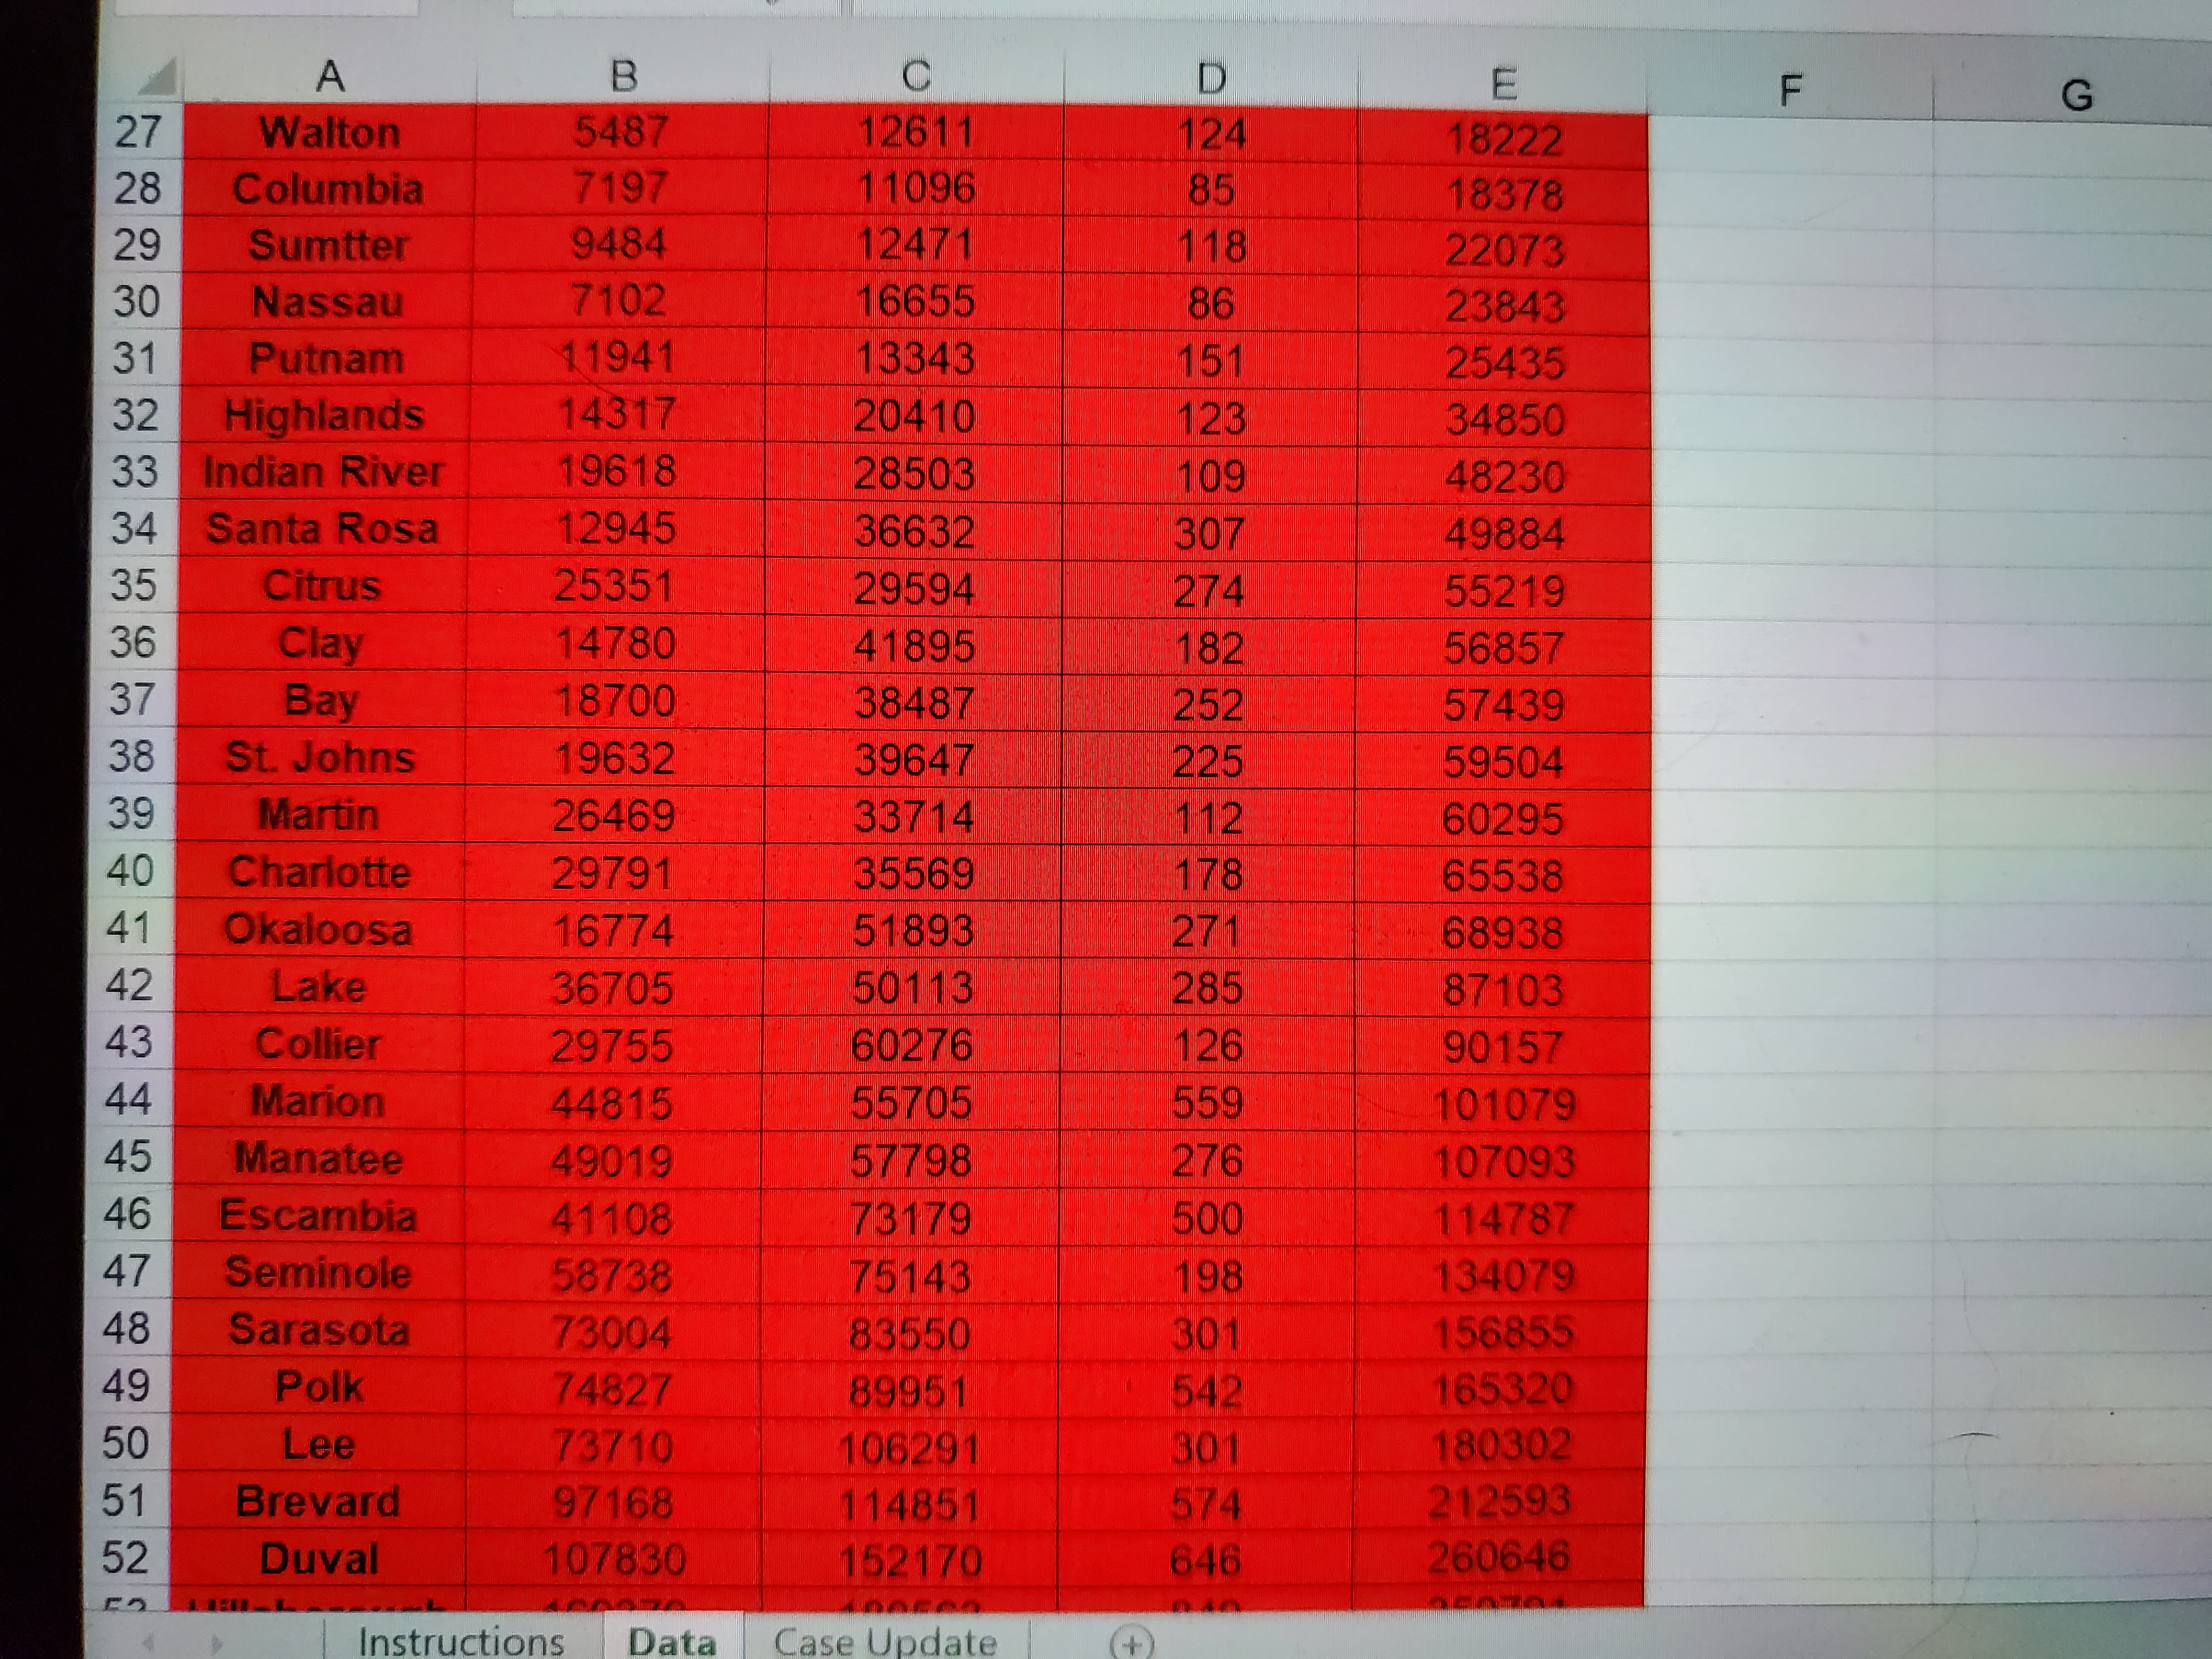
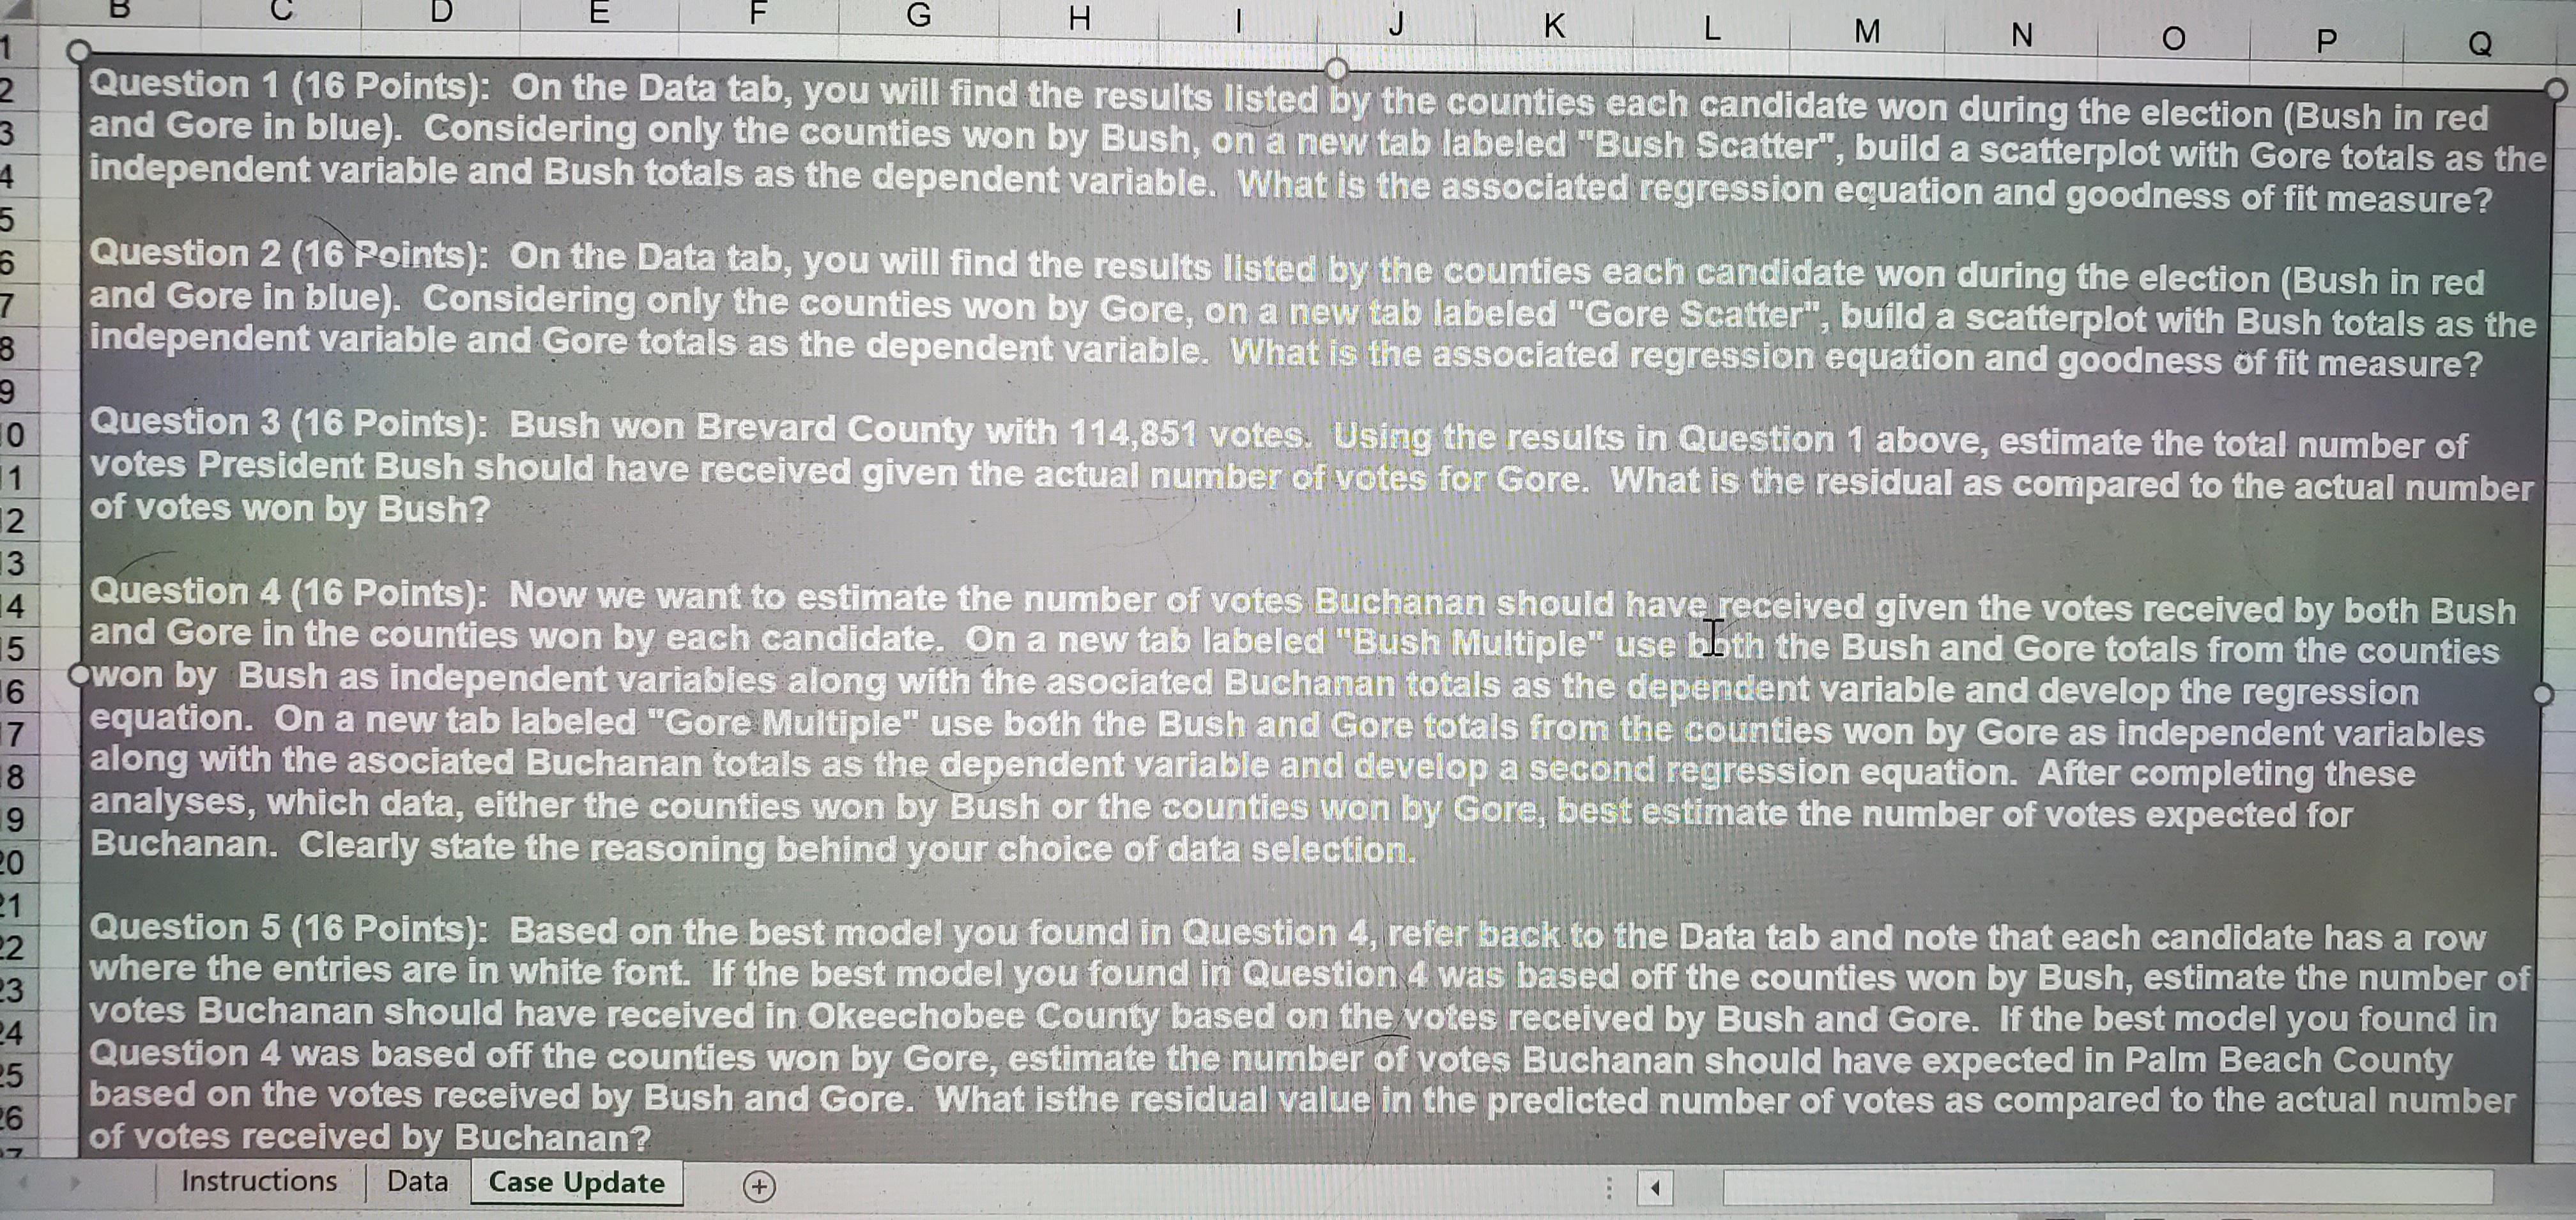
\fA B C D F F 27 Walton 5487 12611 G 124 18222 28 Columbia 7197 1 1096 85 18378 29 Sumtter 9484 12471 118 22073 30 Nassau 7102 16655 86 23843 31 Putnam 11941 13343 151 25435 32 Highlands 14317 20410 123 34850 33 Indian River 19618 28503 109 48230 34 Santa Rosa 12945 36632 307 49884 35 Citrus 25351 29594 274 55219 36 Clay 14780 41895 182 56857 37 Bay 18700 38487 252 57439 38 St. Johns 19632 39647 225 59504 39 Martin 26469 33714 112 60295 40 Charlotte 29791 35569 178 65538 41 Okaloosa 16774 51893 271 68938 42 Lake 36705 50113 285 87103 43 Collier 29755 60276 126 90157 44 Marion 44815 55705 559 101079 45 Manatee 49019 57798 276 107093 46 Escambia 41108 73179 500 114787 47 Seminole 58738 75143 198 134079 48 Sarasota 73004 83550 301 156855 49 Polk 74827 89951 542 165320 50 Lee 73710 106291 301 180302 51 Brevard 97168 114851 574 212593 52 Duval 107830 152170 646 260646 Instructions Data Case UpdateG H K L M N O P Q Question 1 (16 Points): On the Data tab, you will find the results listed by the counties each candidate won during the election (Bush in red and Gore in blue). Considering only the counties won by Bush, on a new tab labeled "Bush Scatter", build a scatterplot with Gore totals as the independent variable and Bush totals as the dependent variable. What is the associated regression equation and goodness of fit measure? Question 2 (16 Points): On the Data tab, you will find the results listed by the counties each candidate won during the election (Bush in red and Gore in blue). Considering only the counties won by Gore, on a new tab labeled "Gore Scatter", build a scatterplot with Bush totals as the independent variable and Gore totals as the dependent variable. What is the associated regression equation and goodness of fit measure? Question 3 (16 Points): Bush won Brevard County with 114,851 votes. Using the results in Question 1 above, estimate the total number of votes President Bush should have received given the actual number of votes for Gore. What is the residual as compared to the actual number of votes won by Bush? UI A Question 4 (16 Points): Now we want to estimate the number of votes Buchanan should have received given the votes received by both Bush and Gore in the counties won by each candidate. On a new tab labeled "Bush Multiple" use both the Bush and Gore totals from the counties 6 won by Bush as independent variables along with the asociated Buchanan totals as the dependent variable and develop the regression equation. On a new tab labeled "Gore Multiple" use both the Bush and Gore totals from the counties won by Gore as independent variables 8 along with the asociated Buchanan totals as the dependent variable and develop a second regression equation. After completing these 9 analyses, which data, either the counties won by Bush or the counties won by Gore, best estimate the number of votes expected for Buchanan. Clearly state the reasoning behind your choice of data selection. Question 5 (16 Points): Based on the best model you found in Question 4, refer back to the Data tab and note that each candidate has a row where the entries are in white font. If the best model you found in Question 4 was based off the counties won by Bush, estimate the number of votes Buchanan should have received in Okeechobee County based on the votes received by Bush and Gore. If the best model you found in Question 4 was based off the counties won by Gore, estimate the number of votes Buchanan should have expected in Palm Beach County based on the votes received by Bush and Gore. What isthe residual value in the predicted number of votes as compared to the actual number of votes received by Buchanan? Instructions Data Case Update +
Step by Step Solution
There are 3 Steps involved in it

Get step-by-step solutions from verified subject matter experts