

Question: My NPV using SUM and NPV is not consistent. need assistance in the sensitivity analysis: i believe you can use What-if Data Table fir Excel
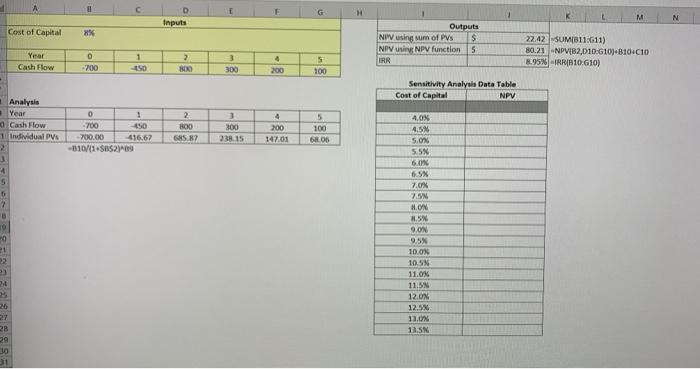
Assignment 1 1. Analyze the project with the cash flows and cost of capital (another way of saying "discount rate") as provided in the worksheet ("Prob 1"). Please analyze the project three ways: a. Underneath each cash flow in the Analysis section, find the individual present value of the cash flow. For the first output (12), using the SUM function in that cell, sum those present values to find the NPV b. For the second answer (13) in the output section, use the NPV function in that cell. Your answers should be consistent. C. For the third answer (14) in the output section, use the IRR function in that cell to find the IRR. d. Perform a sensitivity analysis on this project by varying the cost of capital from 4% to 13.5% as shown in the table starting at 16. Use row 8 to link the table to the model and complete the table using the Data Table function. As an aside, you should see the consistency between the NPV, IRR, and the Sensitivity Analysis. G H D Inputs M N Cost of Capital 8% Outputs NPV using sum of PV's $ NOV SNPV function 5 22.42 SUMB11:611) 80.21 -NPVIB2,010-G10)-810*010 8.95% IRR(810:610) 1 Year Cash Flow D - 200 2 300 3 300 TAR 4 200 5 100 Sensitivity Analysis Data Table Cost of Capital NPV Analysis Year Cash Flow Individual PV 0 1 -700 450 700.00 41667 -010/11 SBS2-09 2 800 5857 1 300 2.15 4 200 147.01 5 100 6. OD 40X 4.5N 5.046 558 3 4 5 6 60% 6.5% 7.07 7. 20 21 HON 2.5 9.00 9.5% 10.03 10.5 11.03 11.5N 12.ON 12.5% 11.0 13.5 P1 3 29 10 31
Step by Step Solution
There are 3 Steps involved in it

Get step-by-step solutions from verified subject matter experts