

Question: My question: Below is a residual plot of a regression model. Note that the fitted values (or y-hats) and the standardized residuals are shown on
My question:
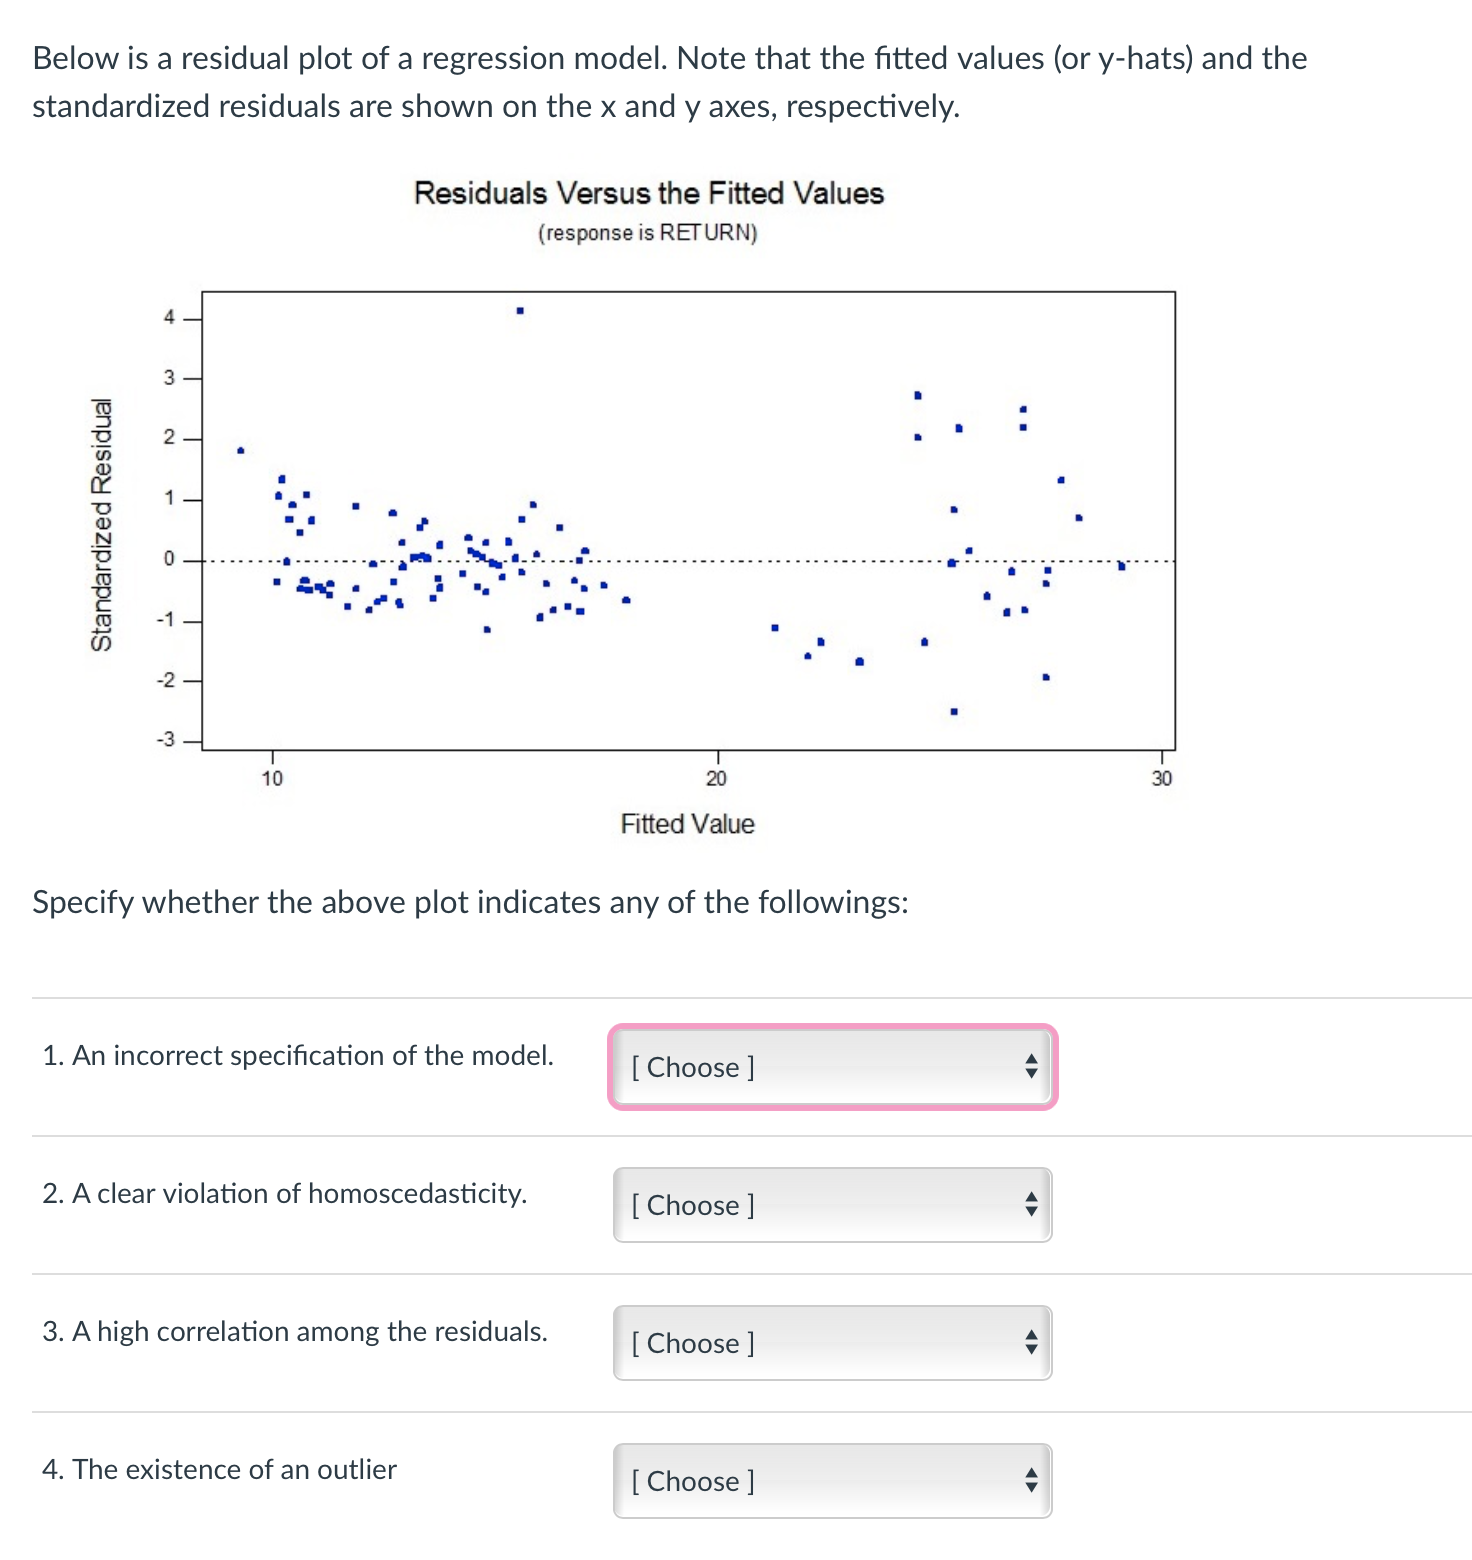
Below is a residual plot of a regression model. Note that the fitted values (or y-hats) and the standardized residuals are shown on the x and y axes, respectively. Residuals Versus the Fitted Values (response is RETURN) N Standardized Residual -1 - -2 - -3 10 20 30 Fitted Value Specify whether the above plot indicates any of the followings: 1. An incorrect specification of the model. [ Choose ] 2. A clear violation of homoscedasticity. [ Choose ] 3. A high correlation among the residuals. [ Choose ] 4. The existence of an outlier [ Choose ]
Step by Step Solution
There are 3 Steps involved in it
1 Expert Approved Answer
Step: 1 Unlock

Question Has Been Solved by an Expert!
Get step-by-step solutions from verified subject matter experts
Step: 2 Unlock
Step: 3 Unlock