

Question: My question is about chapter 4 and last graphs. I find it quite confusing to draw the labels based on previous questions. Any help would
My question is about chapter 4 and last graphs. I find it quite confusing to draw the labels based on previous questions. Any help would be appreciated
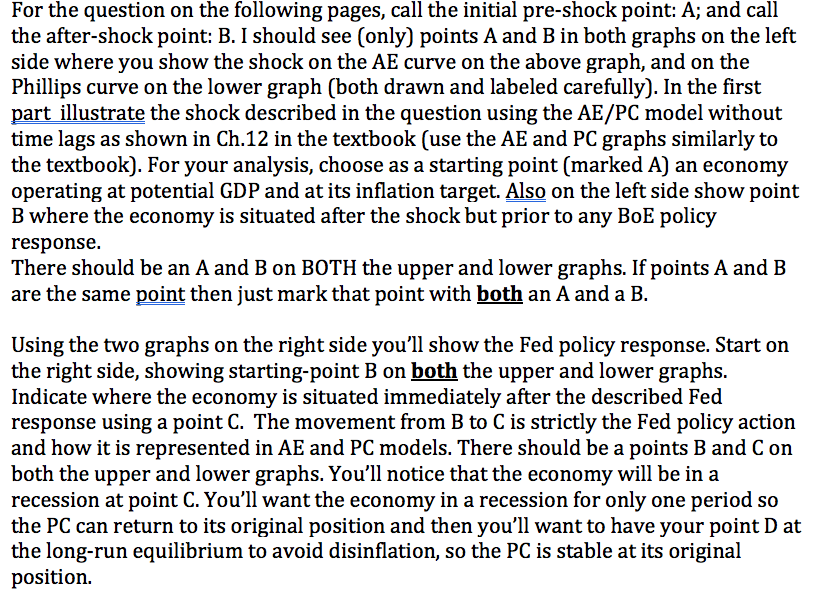
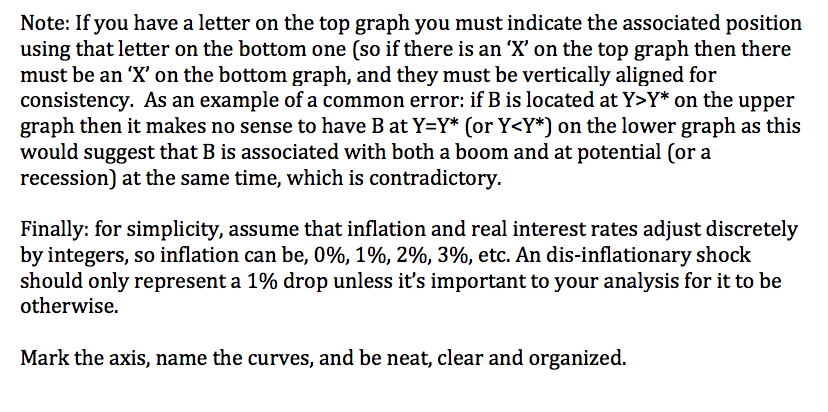
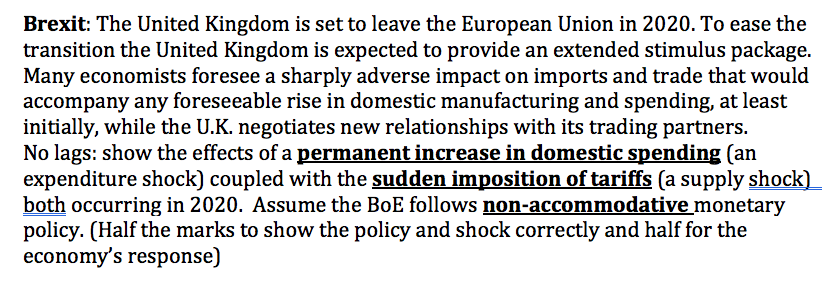
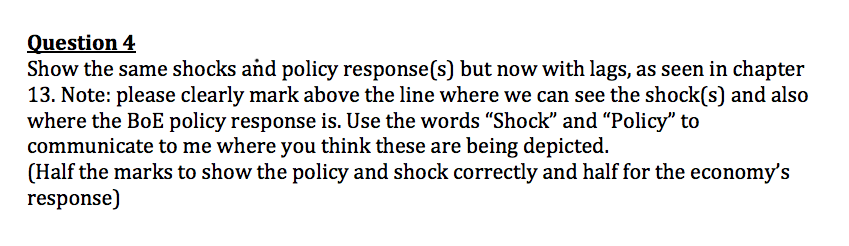
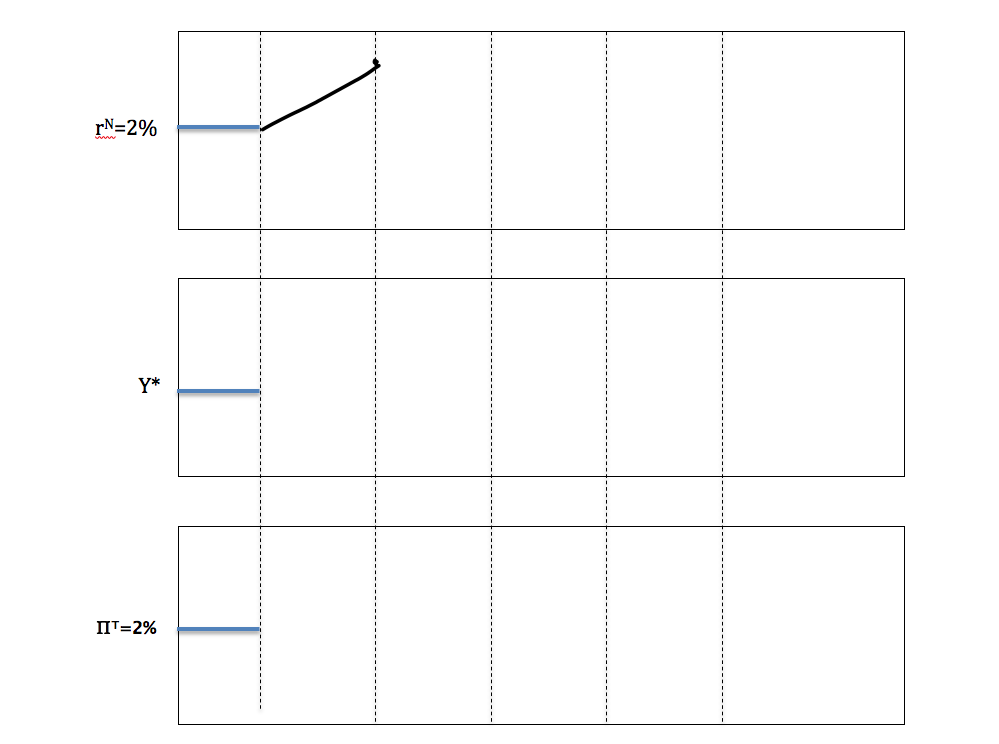
For the question on the following pages, call the initial pre-shock point: A; and call the after-shock point: B. I should see (only) points A and B in both graphs on the left side where you show the shock on the AE curve on the above graph, and on the Phillips curve on the lower graph (both drawn and labeled carefully). In the first part illustrate the shock described in the question using the AE/PC model without time lags as shown in Ch.12 in the textbook (use the AE and PC graphs similarly to the textbook). For your analysis, choose as a starting point (marked A) an economy operating at potential GDP and at its inflation target. Also on the left side show point B where the economy is situated after the shock but prior to any BoE policy response. There should be an A and B on BOTH the upper and lower graphs. If points A and B are the same point then just mark that point with both an A and a B. Using the two graphs on the right side you'll show the Fed policy response. Start on the right side, showing starting-point B on both the upper and lower graphs. Indicate where the economy is situated immediately after the described Fed response using a point C. The movement from B to C is strictly the Fed policy action and how it is represented in AE and PC models. There should be a points B and Con both the upper and lower graphs. You'll notice that the economy will be in a recession at point C. You'll want the economy in a recession for only one period so the PC can return to its original position and then you'll want to have your point D at the long-run equilibrium to avoid disinflation, so the PC is stable at its original position. Note: If you have a letter on the top graph you must indicate the associated position using that letter on the bottom one (so if there is an 'X' on the top graph then there must be an 'X' on the bottom graph, and they must be vertically aligned for consistency. As an example of a common error: if B is located at Y>Y* on the upper graph then it makes no sense to have B at Y=Y* (or YZY*) on the lower graph as this would suggest that B is associated with both a boom and at potential (or a recession) at the same time, which is contradictory. Finally: for simplicity, assume that inflation and real interest rates adjust discretely by integers, so inflation can be, 0%, 1%, 2%, 3%, etc. An dis-inflationary shock should only represent a 1% drop unless it's important to your analysis for it to be otherwise. Mark the axis, name the curves, and be neat, clear and organized. Brexit: The United Kingdom is set to leave the European Union in 2020. To ease the transition the United Kingdom is expected to provide an extended stimulus package. Many economists foresee a sharply adverse impact on imports and trade that would accompany any foreseeable rise in domestic manufacturing and spending, at least initially, while the U.K. negotiates new relationships with its trading partners. No lags: show the effects of a permanent increase in domestic spending (an expenditure shock) coupled with the sudden imposition of tariffs (a supply shock)_ both occurring in 2020. Assume the BoE follows non-accommodative monetary policy. (Half the marks to show the policy and shock correctly and half for the economy's response) Question 4 Show the same shocks and policy response(s) but now with lags, as seen in chapter 13. Note: please clearly mark above the line where we can see the shock(s) and also where the BoE policy response is. Use the words Shock and Policy to communicate to me where you think these are being depicted. (Half the marks to show the policy and shock correctly and half for the economy's response) rN=2% Y* IIT=2% For the question on the following pages, call the initial pre-shock point: A; and call the after-shock point: B. I should see (only) points A and B in both graphs on the left side where you show the shock on the AE curve on the above graph, and on the Phillips curve on the lower graph (both drawn and labeled carefully). In the first part illustrate the shock described in the question using the AE/PC model without time lags as shown in Ch.12 in the textbook (use the AE and PC graphs similarly to the textbook). For your analysis, choose as a starting point (marked A) an economy operating at potential GDP and at its inflation target. Also on the left side show point B where the economy is situated after the shock but prior to any BoE policy response. There should be an A and B on BOTH the upper and lower graphs. If points A and B are the same point then just mark that point with both an A and a B. Using the two graphs on the right side you'll show the Fed policy response. Start on the right side, showing starting-point B on both the upper and lower graphs. Indicate where the economy is situated immediately after the described Fed response using a point C. The movement from B to C is strictly the Fed policy action and how it is represented in AE and PC models. There should be a points B and Con both the upper and lower graphs. You'll notice that the economy will be in a recession at point C. You'll want the economy in a recession for only one period so the PC can return to its original position and then you'll want to have your point D at the long-run equilibrium to avoid disinflation, so the PC is stable at its original position. Note: If you have a letter on the top graph you must indicate the associated position using that letter on the bottom one (so if there is an 'X' on the top graph then there must be an 'X' on the bottom graph, and they must be vertically aligned for consistency. As an example of a common error: if B is located at Y>Y* on the upper graph then it makes no sense to have B at Y=Y* (or YZY*) on the lower graph as this would suggest that B is associated with both a boom and at potential (or a recession) at the same time, which is contradictory. Finally: for simplicity, assume that inflation and real interest rates adjust discretely by integers, so inflation can be, 0%, 1%, 2%, 3%, etc. An dis-inflationary shock should only represent a 1% drop unless it's important to your analysis for it to be otherwise. Mark the axis, name the curves, and be neat, clear and organized. Brexit: The United Kingdom is set to leave the European Union in 2020. To ease the transition the United Kingdom is expected to provide an extended stimulus package. Many economists foresee a sharply adverse impact on imports and trade that would accompany any foreseeable rise in domestic manufacturing and spending, at least initially, while the U.K. negotiates new relationships with its trading partners. No lags: show the effects of a permanent increase in domestic spending (an expenditure shock) coupled with the sudden imposition of tariffs (a supply shock)_ both occurring in 2020. Assume the BoE follows non-accommodative monetary policy. (Half the marks to show the policy and shock correctly and half for the economy's response) Question 4 Show the same shocks and policy response(s) but now with lags, as seen in chapter 13. Note: please clearly mark above the line where we can see the shock(s) and also where the BoE policy response is. Use the words Shock and Policy to communicate to me where you think these are being depicted. (Half the marks to show the policy and shock correctly and half for the economy's response) rN=2% Y* IIT=2%
Step by Step Solution
There are 3 Steps involved in it

Get step-by-step solutions from verified subject matter experts