

Question: MyBama JS Blackboard e Mylscc Jeff State Email Question Completion Status: QUESTION 7 Figure: Consumption of Pizza and Tacos Tacos B A D N 9
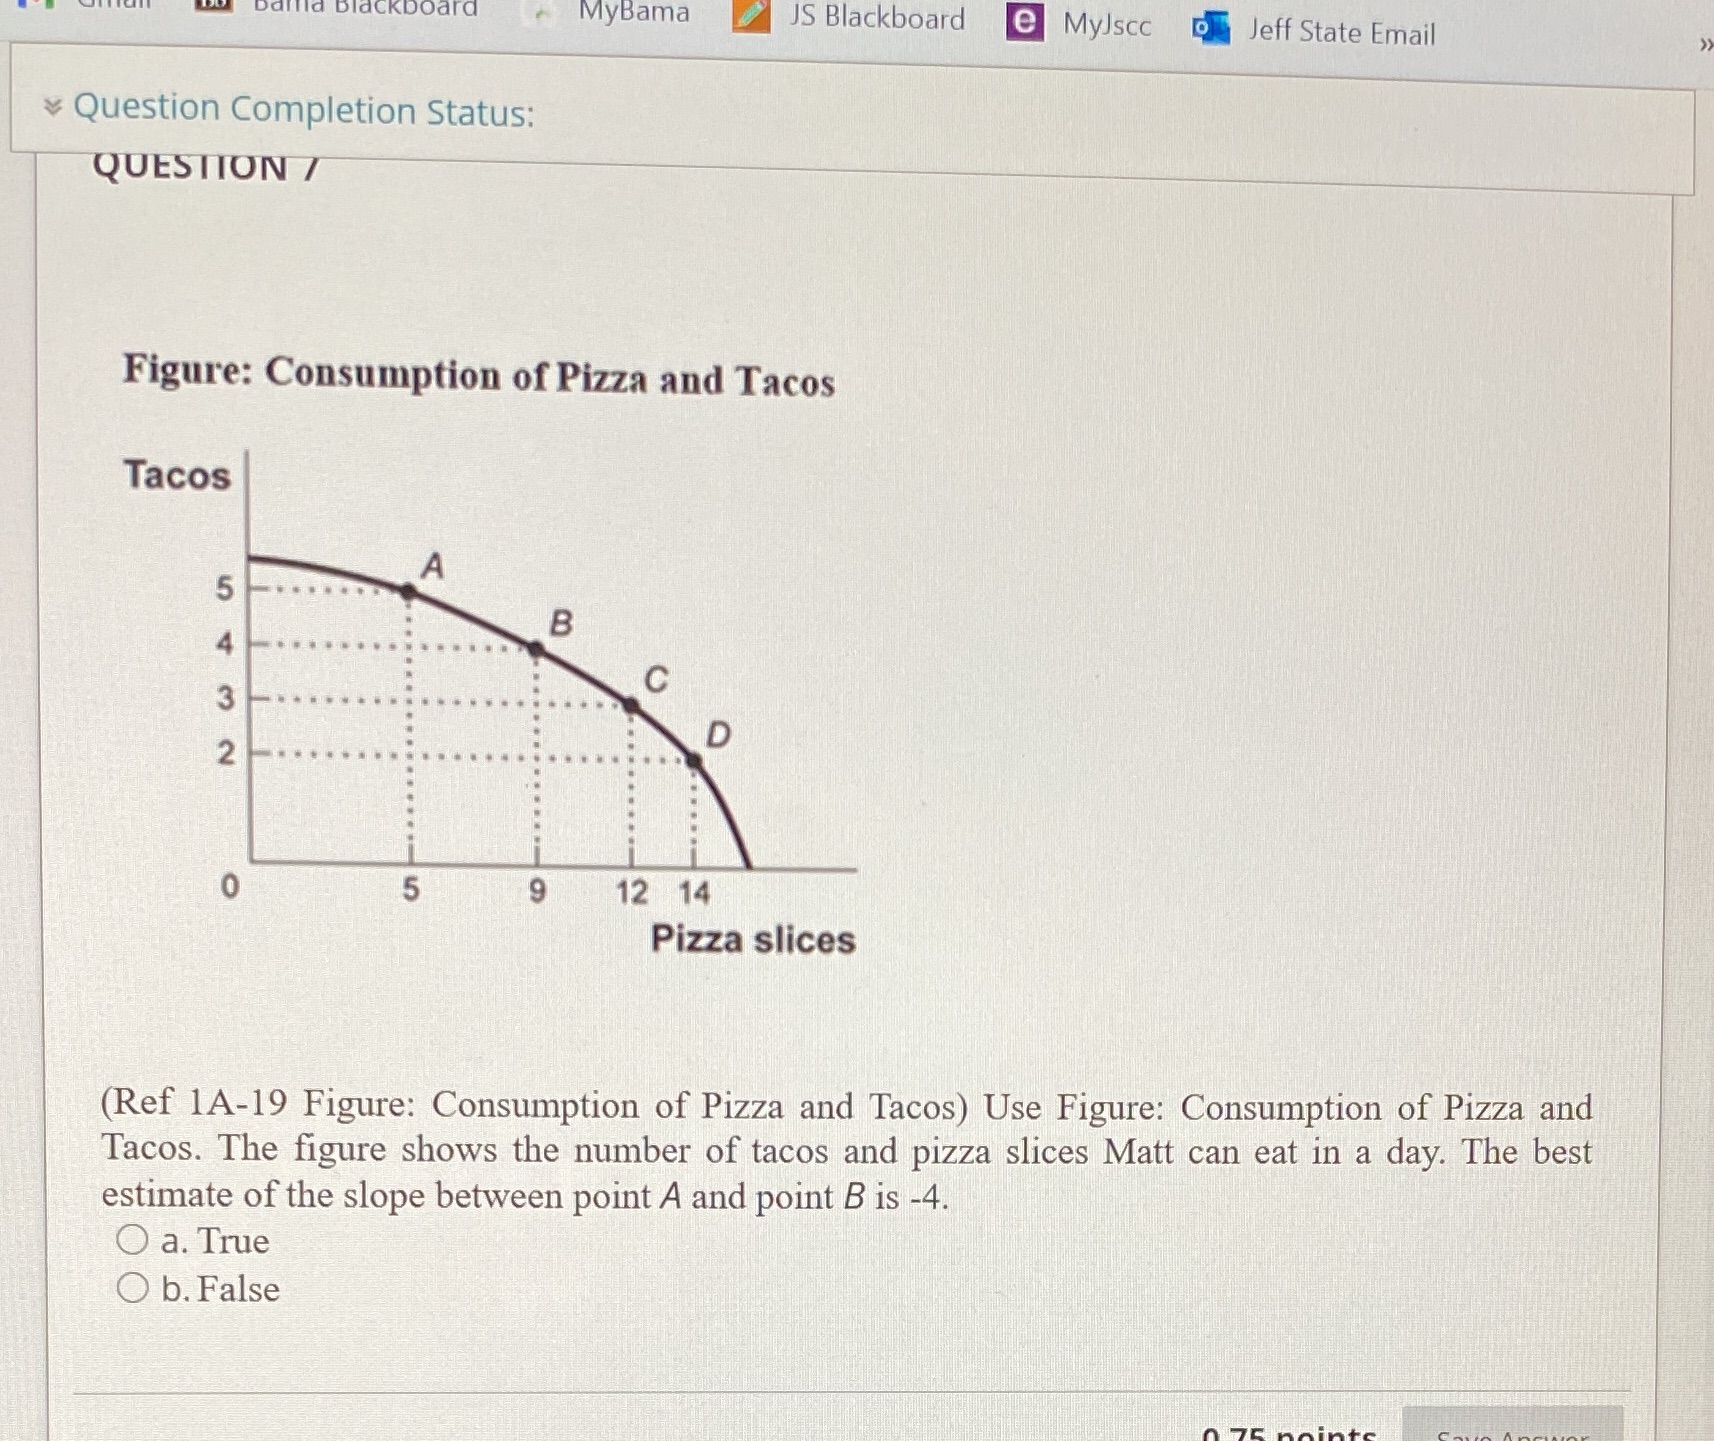

MyBama JS Blackboard e Mylscc Jeff State Email Question Completion Status: QUESTION 7 Figure: Consumption of Pizza and Tacos Tacos B A D N 9 12 14 Pizza slices (Ref 1A-19 Figure: Consumption of Pizza and Tacos) Use Figure: Consumption of Pizza and Tacos. The figure shows the number of tacos and pizza slices Matt can eat in a day. The best estimate of the slope between point A and point B is -4. O a. True O b. False
Step by Step Solution
There are 3 Steps involved in it
1 Expert Approved Answer
Step: 1 Unlock

Question Has Been Solved by an Expert!
Get step-by-step solutions from verified subject matter experts
Step: 2 Unlock
Step: 3 Unlock