

Question: mylab.pearson.com + Assignments Do Homework - Section 2.4 Homework Grades for Kailyn Simmons: 2022SP MATH-1342-82001 Math 1342-82001 Elementary Statistcs Kailyn Simmons 03/11/22 10:51 PM Homework:
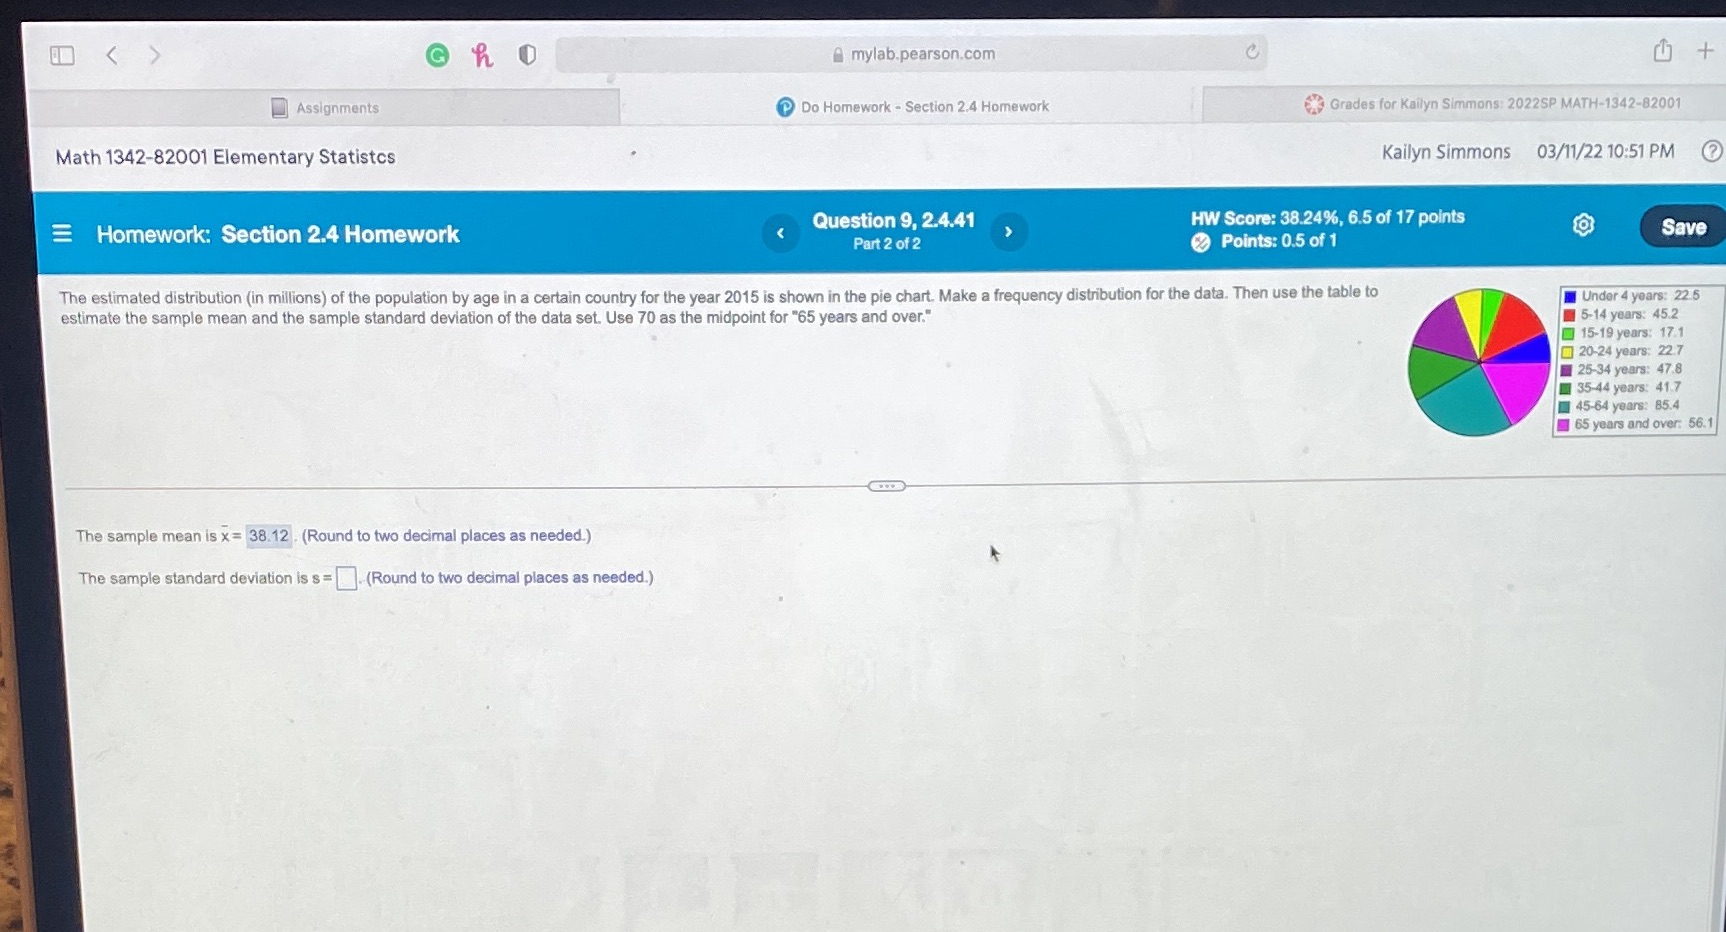
mylab.pearson.com + Assignments Do Homework - Section 2.4 Homework Grades for Kailyn Simmons: 2022SP MATH-1342-82001 Math 1342-82001 Elementary Statistcs Kailyn Simmons 03/11/22 10:51 PM Homework: Section 2.4 Homework Question 9, 2.4.41 HW Score: 38.24%, 6.5 of 17 points Part 2 of 2 Points: 0.5 of 1 Save The estimated distribution (in millions) of the population by age in a certain country for the year 2015 is shown in the pie chart. Make a frequency distribution for the data. Then use the table to Under 4 years: 22.5 estimate the sample mean and the sample standard deviation of the data set. Use 70 as the midpoint for "65 years and over." 5-14 years: 45.2 15-19 years: 17.1 20-24 years: 22.7 25-34 years: 47.8 35-44 years: 41.7 45-64 years: 85.4 65 years and over: 56.1 The sample mean is x= 38.12 . (Round to two decimal places as needed.) The sample standard deviation is s= ]. (Round to two decimal places as needed.)
Step by Step Solution
There are 3 Steps involved in it

Get step-by-step solutions from verified subject matter experts