

Question: myopenmath.com The graph illustrates a normal distribution for the prices paid for a particular model of HD television. The mean price paid is $1800
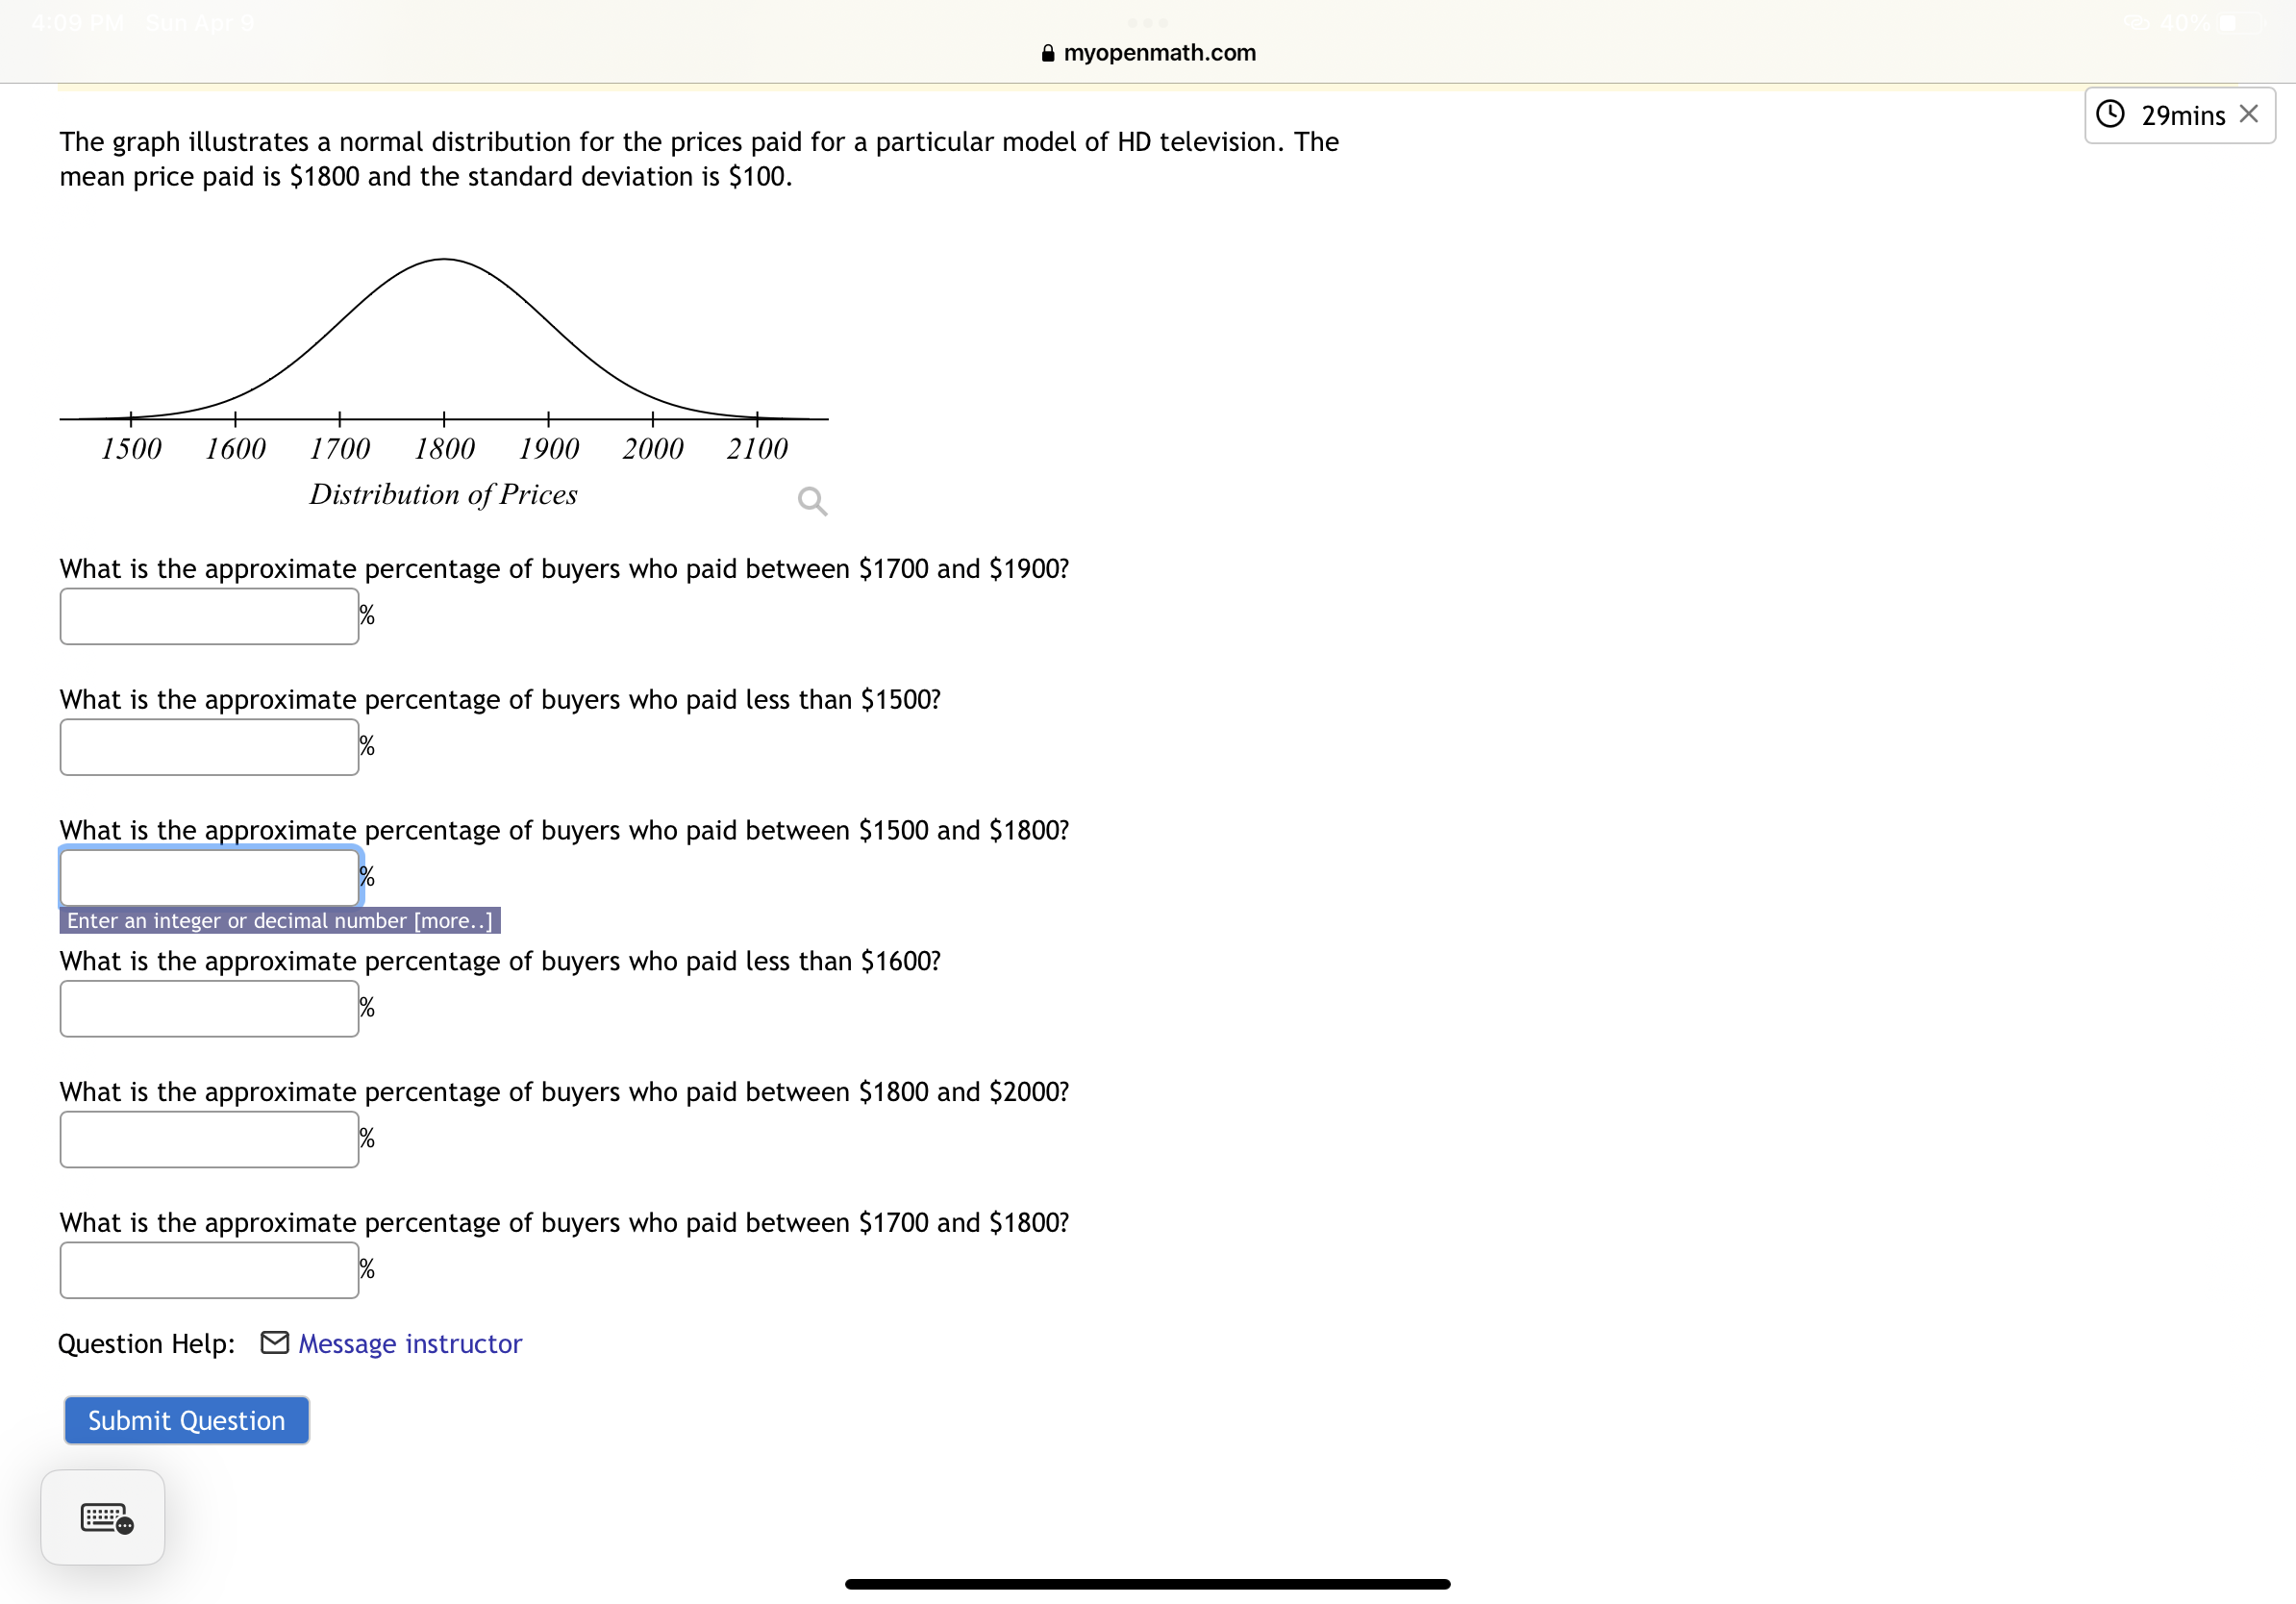
myopenmath.com The graph illustrates a normal distribution for the prices paid for a particular model of HD television. The mean price paid is $1800 and the standard deviation is $100. 29mins X 1500 1600 1700 1800 1900 2000 2100 Distribution of Prices What is the approximate percentage of buyers who paid between $1700 and $1900? % What is the approximate percentage of buyers who paid less than $1500? What is the approximate percentage of buyers who paid between $1500 and $1800? % Enter an integer or decimal number [more..] What is the approximate percentage of buyers who paid less than $1600? What is the approximate percentage of buyers who paid between $1800 and $2000? % What is the approximate percentage of buyers who paid between $1700 and $1800? Question Help: Message instructor Submit Question 4:09 PM Sun Apr 9 myopenmath.com A normal distribution has a mean of 129 and a standard deviation of 10. Find the z-score for a data value of 137. 30mins X Round to two decimal places Question Help: Message instructor Submit Question
Step by Step Solution
There are 3 Steps involved in it

Get step-by-step solutions from verified subject matter experts