

Question: n = 2 n = 5 n = 10 n = 30 Mean 25.0979 24.9698 24.9575 25.0405 Standard Deviation 3.455 2.2625 1.5809 0.9065 Shape Skewed

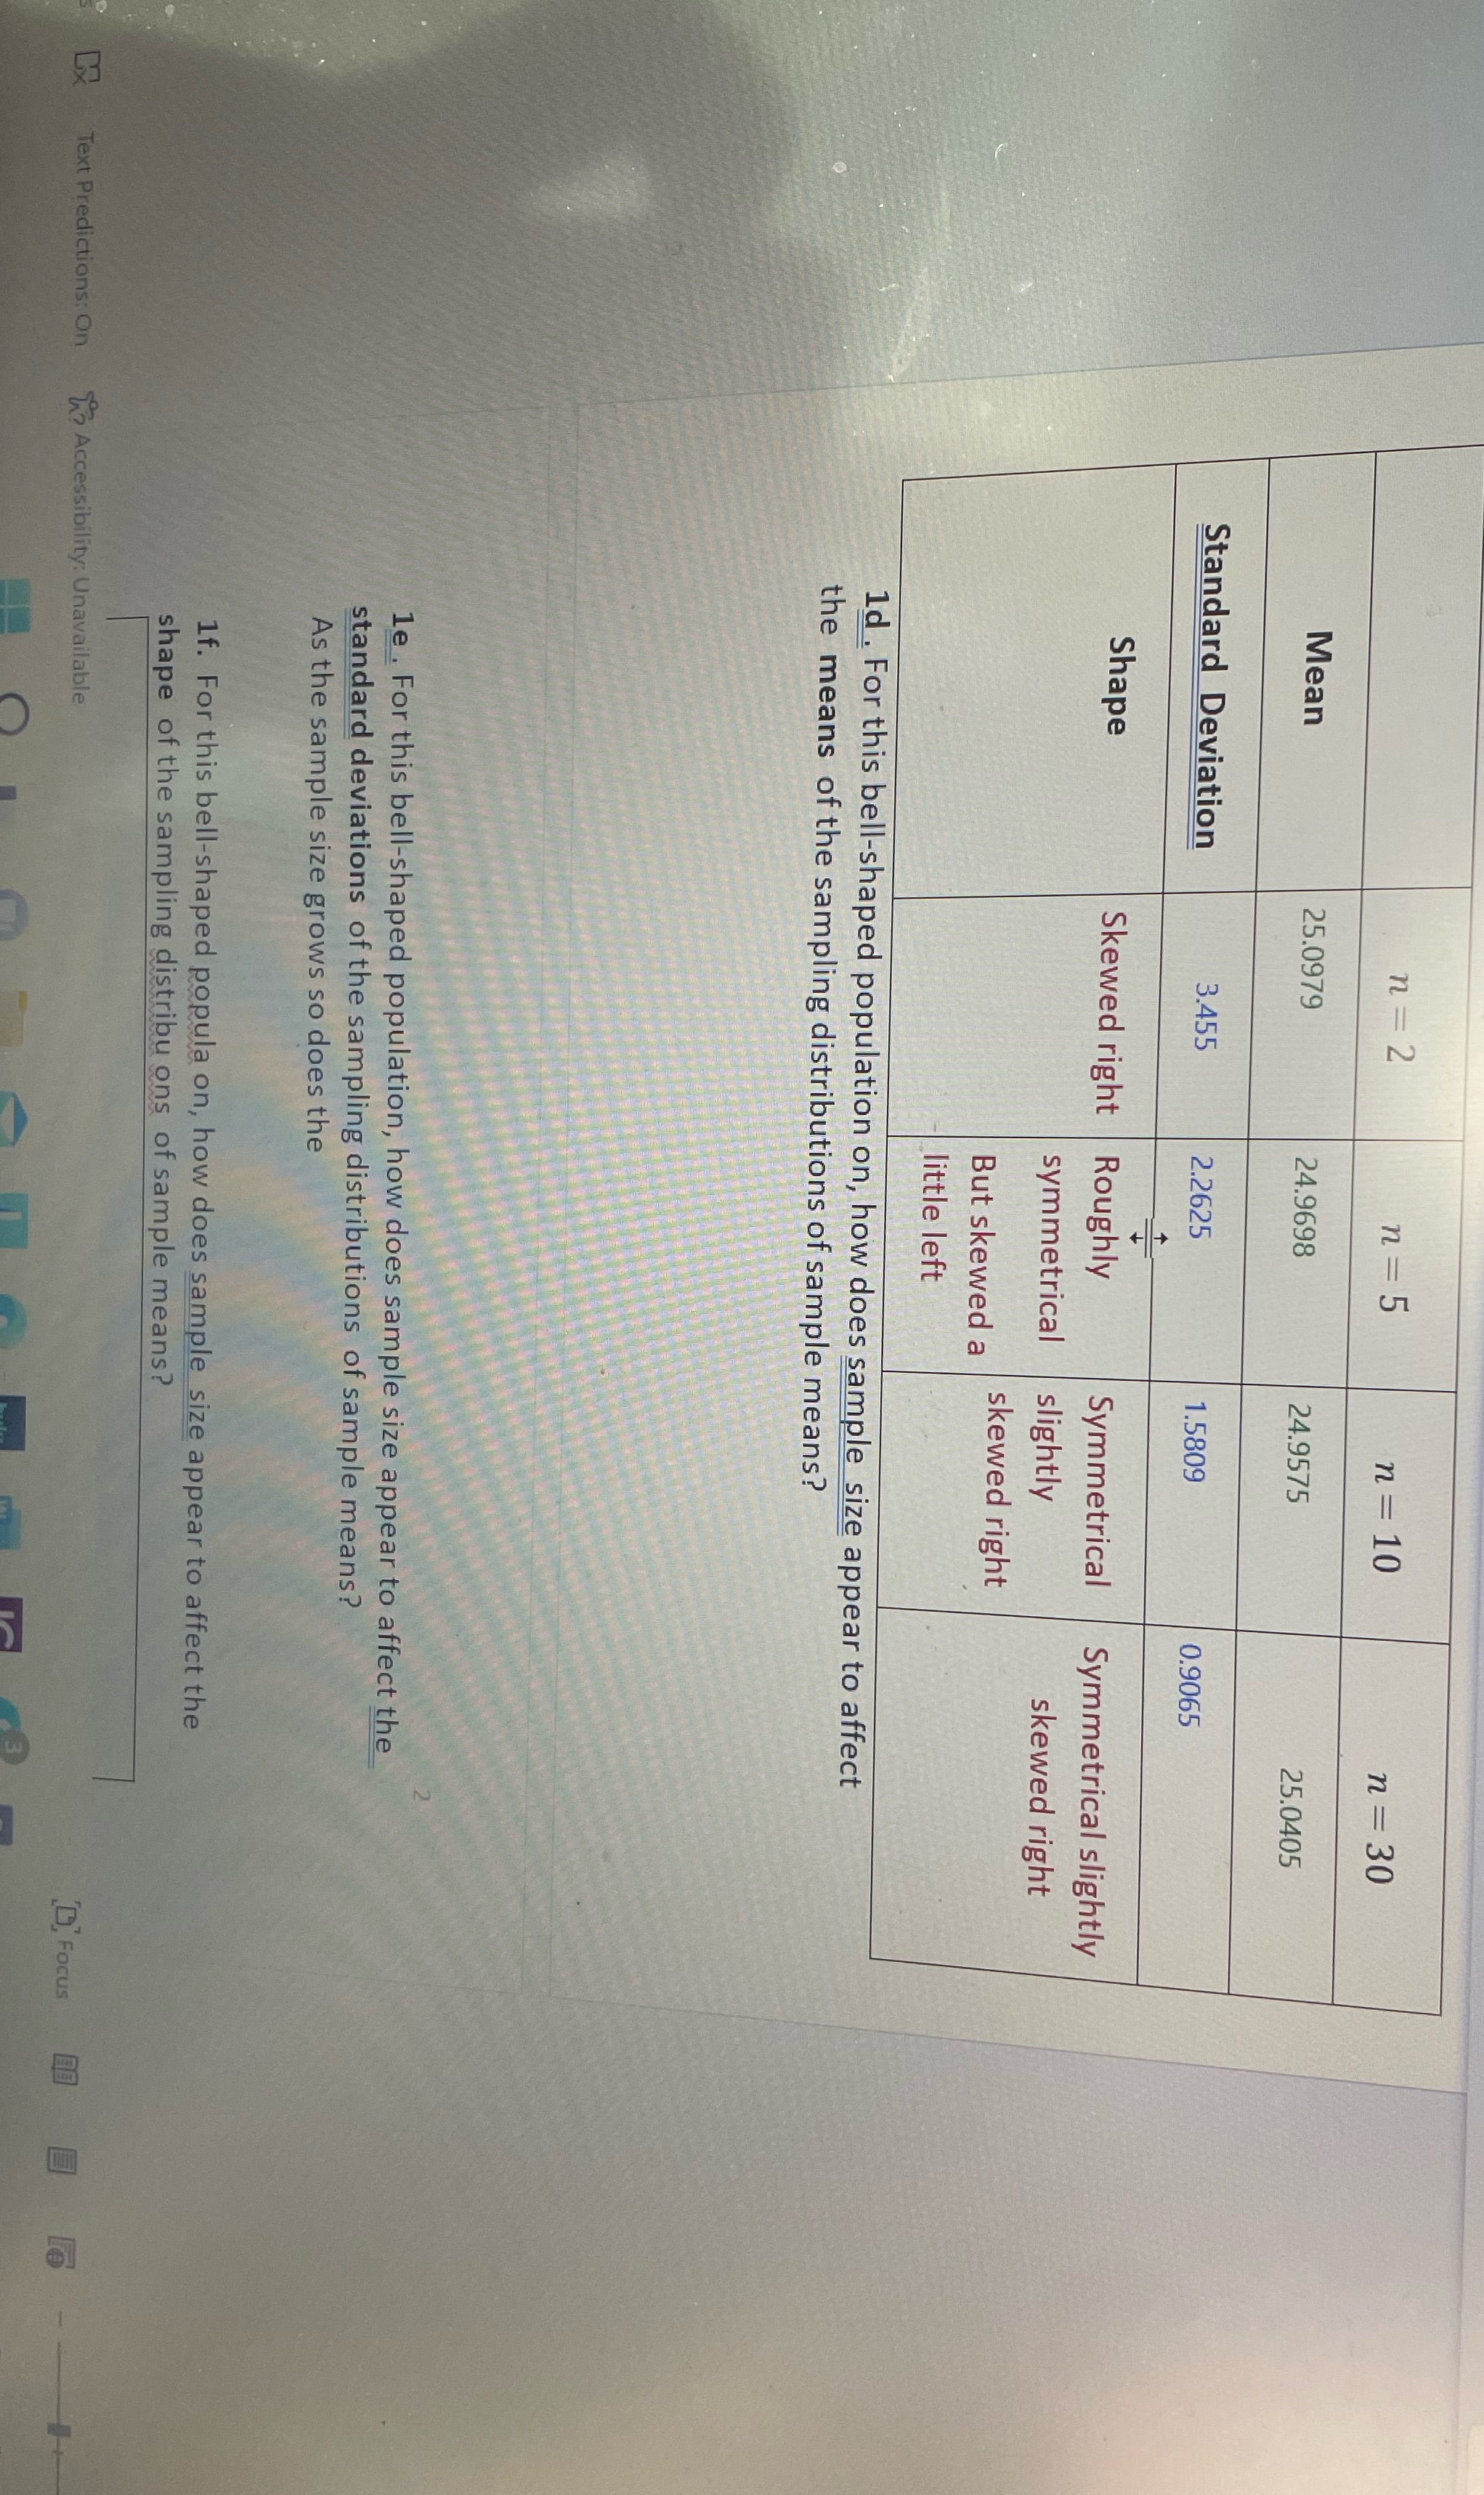
n = 2 n = 5 n = 10 n = 30 Mean 25.0979 24.9698 24.9575 25.0405 Standard Deviation 3.455 2.2625 1.5809 0.9065 Shape Skewed right Roughly Symmetrical Symmetrical slightly symmetrical slightly skewed right But skewed a skewed right little left 1d . For this bell-shaped population on, how does sample size appear to affect the means of the sampling distributions of sample means? N le . For this bell-shaped population, how does sample size appear to affect the standard deviations of the sampling distributions of sample means? As the sample size grows so does the 1f. For this bell-shaped popula on, how does sample size appear to affect the shape of the sampling distribu ons of sample means? Text Predictions: On 1?Accessibility: Unavailable D Focus
Step by Step Solution
There are 3 Steps involved in it

Get step-by-step solutions from verified subject matter experts