

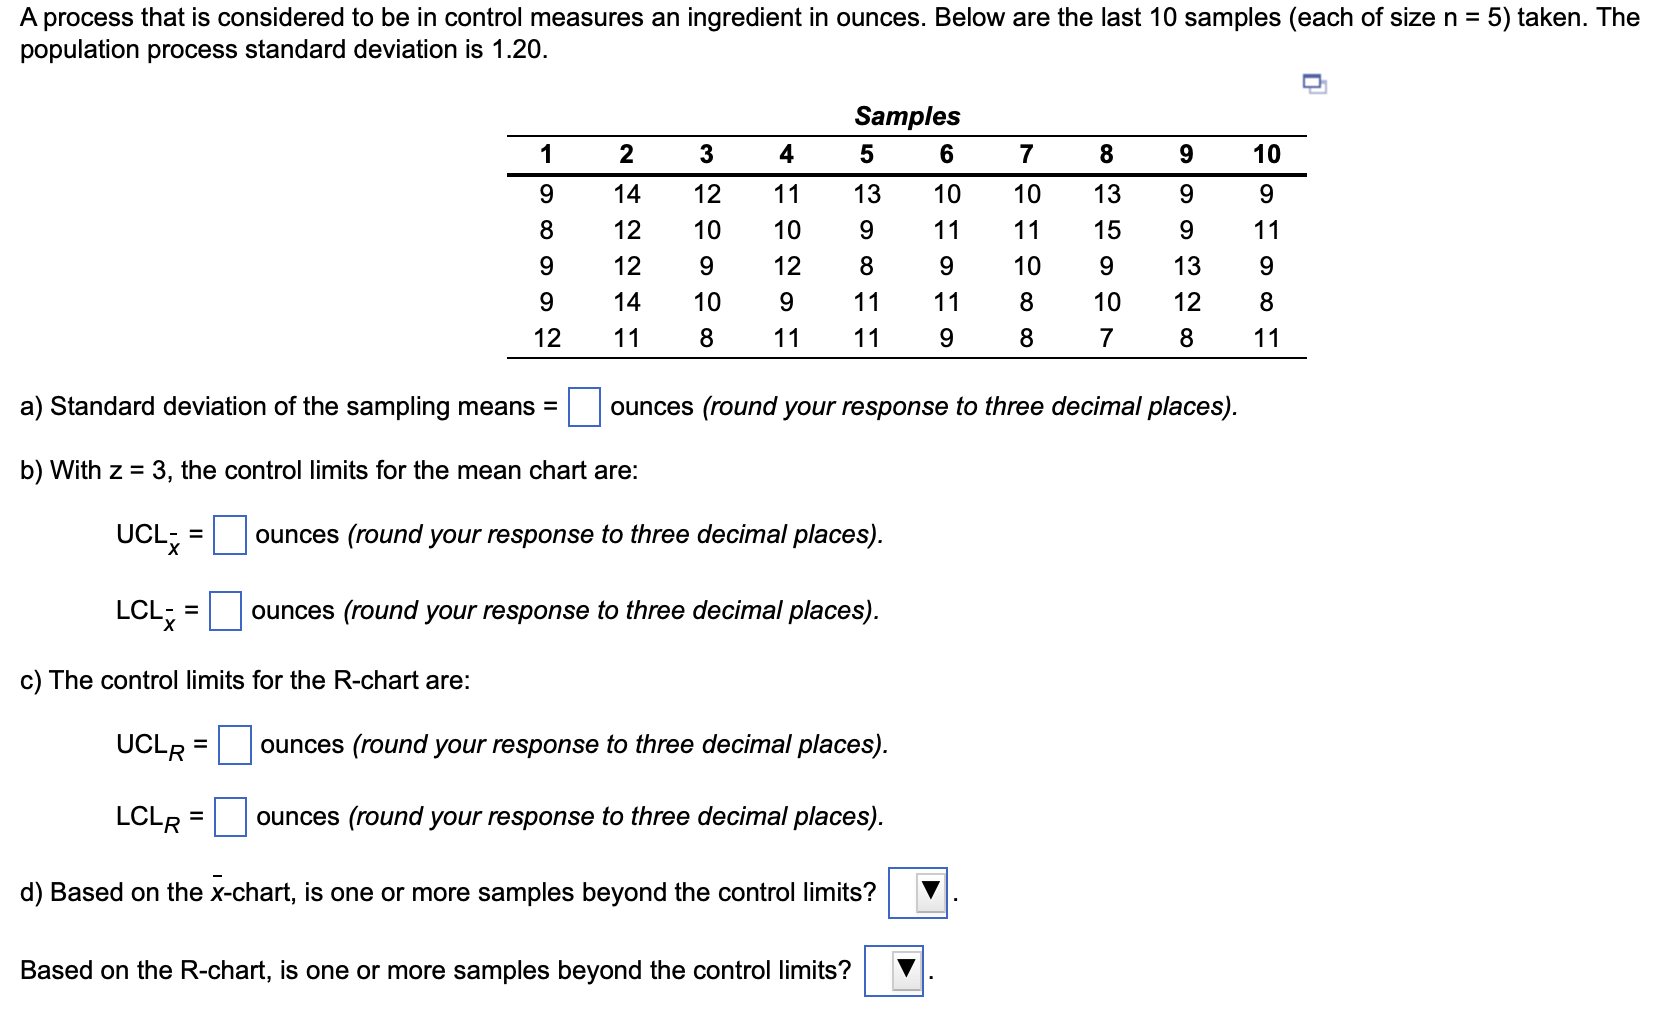
Question: n = 5 z = 3 , the control l i m i t s for the mean chart are: U C L x =
the control for the mean chart are:
ounces your response three decimal places
ounces your response three decimal places
ounces your response three decimal places
ounces your response three decimal places
chart, one more samples beyond the control
Based the chart, one more samples beyond the control
Step by Step Solution
There are 3 Steps involved in it
1 Expert Approved Answer
Step: 1 Unlock

Question Has Been Solved by an Expert!
Get step-by-step solutions from verified subject matter experts
Step: 2 Unlock
Step: 3 Unlock