

Question: N A 1 Q# 2 Marks 3 A. 4 B C D E F H L M Your fina answers must be provided in cells
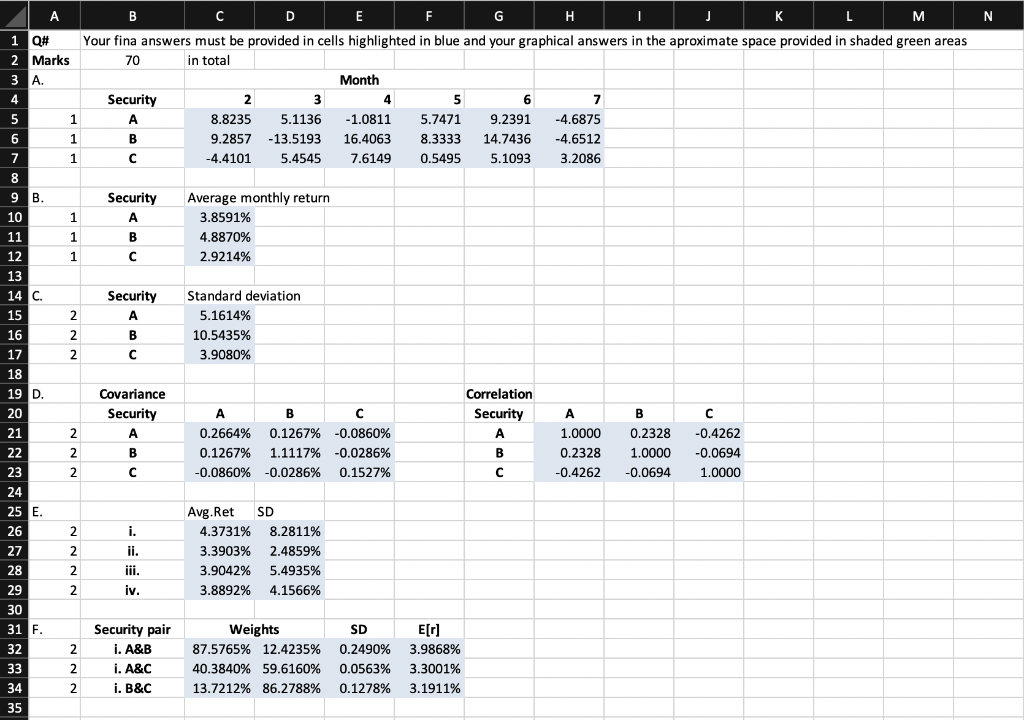
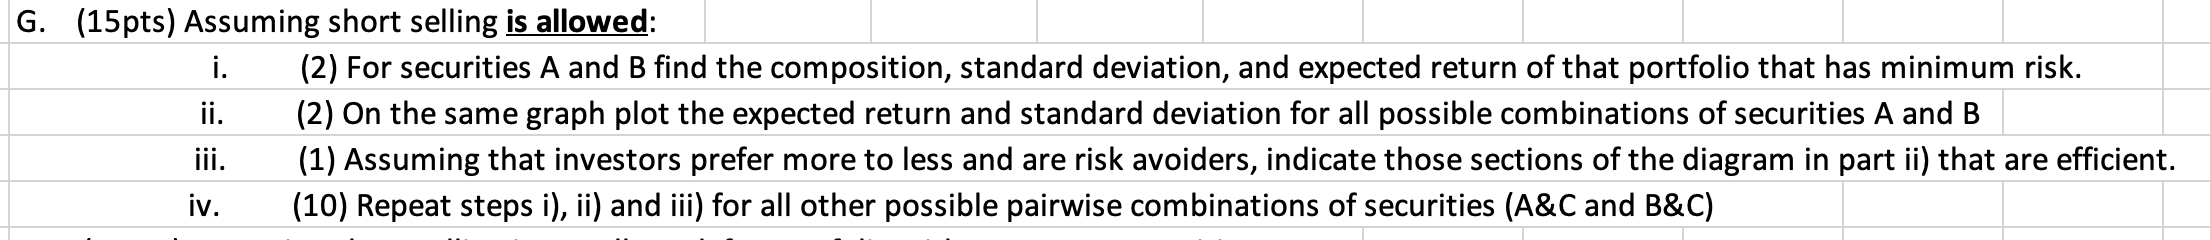
N A 1 Q# 2 Marks 3 A. 4 B C D E F H L M Your fina answers must be provided in cells highlighted in blue and your graphical answers in the aproximate space provided in shaded green areas 70 in total Month Security 2 3 4 5 6 7 A 8.8235 5.1136 -1.0811 5.7471 9.2391 -4.6875 B 9.2857 -13.5193 16.4063 8.3333 14.7436 -4.6512 -4.4101 5.4545 7.6149 0.5495 5.1093 3.2086 5 1 6 1 1 1 7 8 9 B. 10 11 12 13 14 C. 15 Security A B Average monthly return 3.8591% 4.8870% 2.9214% 1 1 Security A 2 Standard deviation 5.1614% 10.5435% 3.9080% B 2 2 16 17 18 19 D. 20 21 22 23 24 25 E Covariance Security A 2 2 2 A B 0.2664% 0.1267% -0.0860% 0.1267% 1.1117% -0.0286% -0.0860% -0.0286% 0.1527% Correlation Security A B A 1.0000 0.2328 -0.4262 B 0.2328 1.0000 -0.0694 C -0.4262 -0.0694 1.0000 B 2 i. ii. 2 26 27 28 29 Avg. Ret 4.3731% 3.3903% 3.9042% 3.8892% SD 8.2811% 2.4859% 5.4935% 4.1566% 2 iii. 2 iv. 2 30 31 F. 32 33 34 35 Security pair i. A&B i. A&C i. B&C Weights 87.5765% 12.4235% 40.3840% 59.6160% 13.7212% 86.2788% SD 0.2490% 0.0563% 0.1278% E[r] 3.9868% 3.3001% 3.1911% 2 2 G. (15pts) Assuming short selling is allowed: i. (2) For securities A and B find the composition, standard deviation, and expected return of that portfolio that has minimum risk. ji. (2) On the same graph plot the expected return and standard deviation for all possible combinations of securities A and B iii. (1) Assuming that investors prefer more to less and are risk avoiders, indicate those sections of the diagram in part ii) that are efficient. iv. (10) Repeat steps i), ii) and iii) for all other possible pairwise combinations of securities (A&C and B&C) N A 1 Q# 2 Marks 3 A. 4 B C D E F H L M Your fina answers must be provided in cells highlighted in blue and your graphical answers in the aproximate space provided in shaded green areas 70 in total Month Security 2 3 4 5 6 7 A 8.8235 5.1136 -1.0811 5.7471 9.2391 -4.6875 B 9.2857 -13.5193 16.4063 8.3333 14.7436 -4.6512 -4.4101 5.4545 7.6149 0.5495 5.1093 3.2086 5 1 6 1 1 1 7 8 9 B. 10 11 12 13 14 C. 15 Security A B Average monthly return 3.8591% 4.8870% 2.9214% 1 1 Security A 2 Standard deviation 5.1614% 10.5435% 3.9080% B 2 2 16 17 18 19 D. 20 21 22 23 24 25 E Covariance Security A 2 2 2 A B 0.2664% 0.1267% -0.0860% 0.1267% 1.1117% -0.0286% -0.0860% -0.0286% 0.1527% Correlation Security A B A 1.0000 0.2328 -0.4262 B 0.2328 1.0000 -0.0694 C -0.4262 -0.0694 1.0000 B 2 i. ii. 2 26 27 28 29 Avg. Ret 4.3731% 3.3903% 3.9042% 3.8892% SD 8.2811% 2.4859% 5.4935% 4.1566% 2 iii. 2 iv. 2 30 31 F. 32 33 34 35 Security pair i. A&B i. A&C i. B&C Weights 87.5765% 12.4235% 40.3840% 59.6160% 13.7212% 86.2788% SD 0.2490% 0.0563% 0.1278% E[r] 3.9868% 3.3001% 3.1911% 2 2 G. (15pts) Assuming short selling is allowed: i. (2) For securities A and B find the composition, standard deviation, and expected return of that portfolio that has minimum risk. ji. (2) On the same graph plot the expected return and standard deviation for all possible combinations of securities A and B iii. (1) Assuming that investors prefer more to less and are risk avoiders, indicate those sections of the diagram in part ii) that are efficient. iv. (10) Repeat steps i), ii) and iii) for all other possible pairwise combinations of securities (A&C and B&C)
Step by Step Solution
There are 3 Steps involved in it

Get step-by-step solutions from verified subject matter experts