Question: N C D F G H K M E Year O Year 1 Year 2 Year 3 Year 4 Year 5 Year 6 Information/Variables Revenues
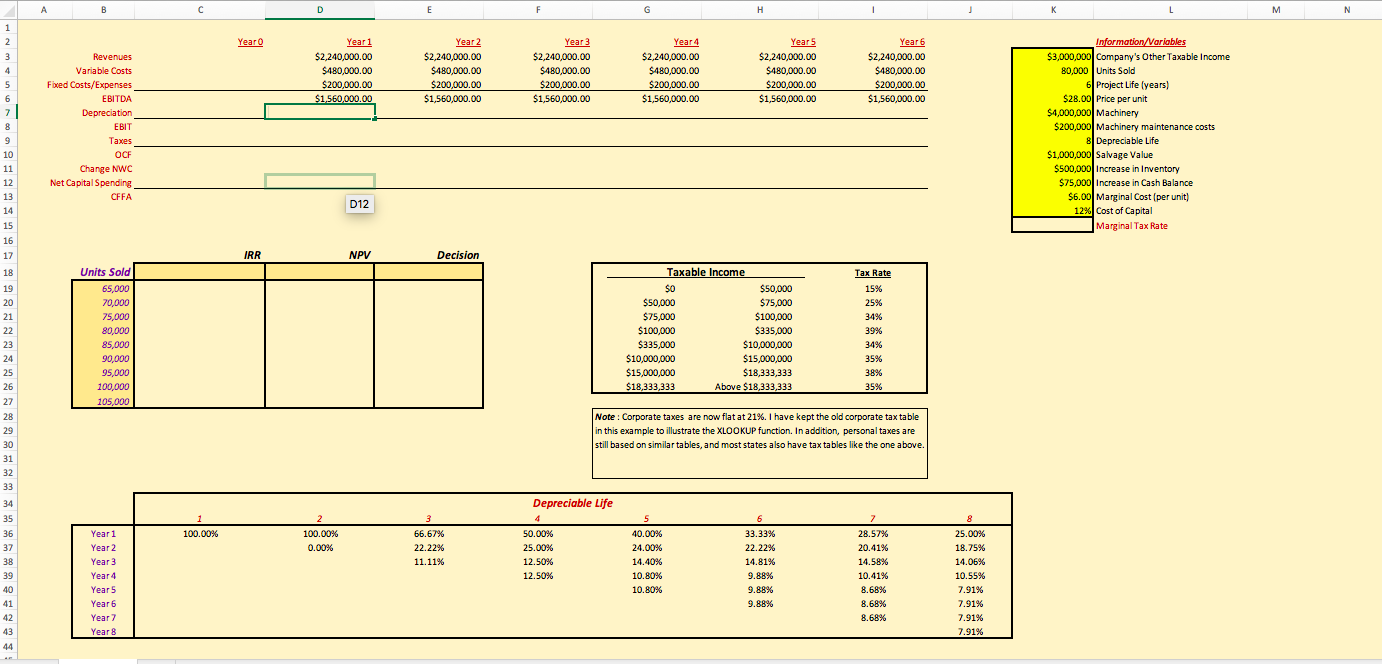
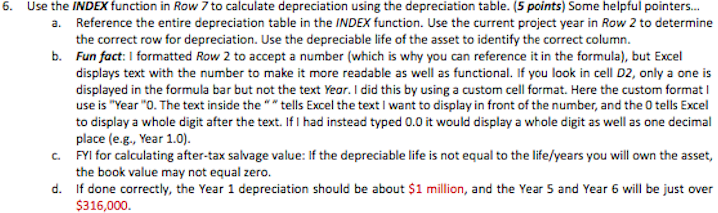
N C D F G H K M E Year O Year 1 Year 2 Year 3 Year 4 Year 5 Year 6 Information/Variables Revenues $2,240,000.00 $2,240,000.00 $2,240,000.00 $2,240,000.00 $2,240,000.00 $2,240,000.00 $3,000,000 Company's Other Taxable Income Variable Costs $180,000.00 $480,000.00 $480,000.00 $480,000.00 $480,000.00 $480,000.00 80,000 | Units Sold $200,000.00 $200,000.00 6200,000.00 $200,000.00 6 Project Life [years) Fixed Costs/Expenses $200,000.00 $200,000.00 $28.00| Price per unit EBITDA $1.560,000.00 $1,560,000.00 $1,560,000.00 $1,560,000.00 $1,560,000.00 $1,560,000.00 $4,000,000| Machinery Depreciation $200,000| Machinery maintenance costs EBIT 8 Depreciable Life Taxes $1,000,000 Salvage Value OCF $500,000 Increase in Inventory Change NWC $75,000 Increase in Cash Balance Net Capital Spending $6.00| Marginal Cost (per unit) CFFA D12 12% Cost of Capital Marginal Tax Rate IRR NPV Decision Units Sold Taxable Income Tax Rate 65,000 50 $50,000 15% $50,000 $75,000 25% 70,000 75,000 $75,000 $100,000 34% 80,000 $100,000 $335,000 39%% 85,000 $335,000 $10,000,000 34% 90,000 $10,000,000 $15,000,000 35% 95,000 $15,000,000 $18,333,333 38% 100,000 $18,333,333 Above $18,333,333 35% 105,000 Note : Corporate taxes are now flat at 21%%. I have kept the old corporate tax table in this example to illustrate the XLOOKUP function. In addition, personal taxes are still based on similar tables, and most states also have tax tables like the one above. Depreciable Life 36 Year 1 100.00% 100.00% 66.67% 50.00% 40.00% KEE'EE 28.57% 25.00% Year 2 0.00% 22.22%% 25.00% 24.00% 22.22% 20.41% 18.75%% Year 3 11.11% 12.50% 14.40% 14.81% 14.58% 14.06% Year 4 12.50% 10.80% 9.88% 10.41% 10.55% 10.80% 8.68% 7.91% Year 5 9.88% Year 6 9.88% 8.68% 7.91% Year 7 8.68% 7.91% 7.91% Year B 446. Use the INDEX function in Row / to calculate depreciation using the depreciation table. (5 points) Some helpful pointers... a. Reference the entire depreciation table in the INDEX function. Use the current project year in Row 2 to determine the correct row for depreciation. Use the depreciable life of the asset to identify the correct column. b. Fun fact: I formatted Row 2 to accept a number (which is why you can reference it in the formula), but Excel displays text with the number to make it more readable as well as functional. If you look in cell D2, only a one is displayed in the formula bar but not the text Year. I did this by using a custom cell format. Here the custom format I use is "Year "O. The text inside the ""tells Excel the text I want to display in front of the number, and the 0 tells Excel to display a whole digit after the text. If I had instead typed 0.0 it would display a whole digit as well as one decimal place (e.g., Year 1.0). C. FYI for calculating after-tax salvage value: If the depreciable life is not equal to the life/years you will own the asset, the book value may not equal zero. d. If done correctly, the Year 1 depreciation should be about $1 million, and the Year S and Year 6 will be just over $316,000
Step by Step Solution
There are 3 Steps involved in it
1 Expert Approved Answer
Step: 1 Unlock
Question Has Been Solved by an Expert!
Get step-by-step solutions from verified subject matter experts
Step: 2 Unlock
Step: 3 Unlock
Students Have Also Explored These Related Accounting Questions!