

Question: n each ofthese 3graphs, the average scoreis the same.The averagescore is 75. Inwhat otherways are thegraphs similar?How are theydifferent?What is themostdistinctive feature thatdistinguishesthese threegraphs fromeach
n each ofthese 3graphs, the average scoreis the same.The averagescore is 75. Inwhat otherways are thegraphs similar?How are theydifferent?What is themostdistinctive feature thatdistinguishesthese threegraphs fromeach other? b) What mightexplain thedifferences inthese graphs? 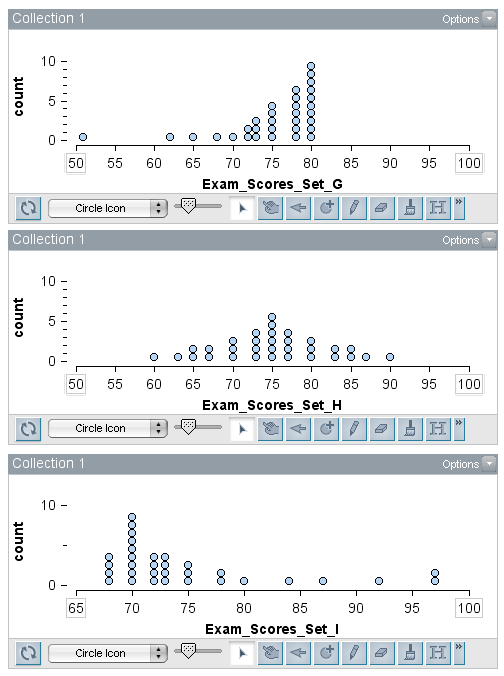
Collection 1 10 50 55 60 65 70 75 80 85 Circle Icon Collection 1 count 3 10- Exam Scores_Set_G Options 90 90 95 100 AH Options 0 50 55 00-10 00 2-000 60 65 70 000000 - 12 75 80 85 90 95 100 Exam Scores_Set_H Circle Icon Collection 1 10- 0- 65 70 75 80 85 90 Exam Scores_Set_I Circle Icon H" Options 95 100 H
Step by Step Solution
There are 3 Steps involved in it

Get step-by-step solutions from verified subject matter experts