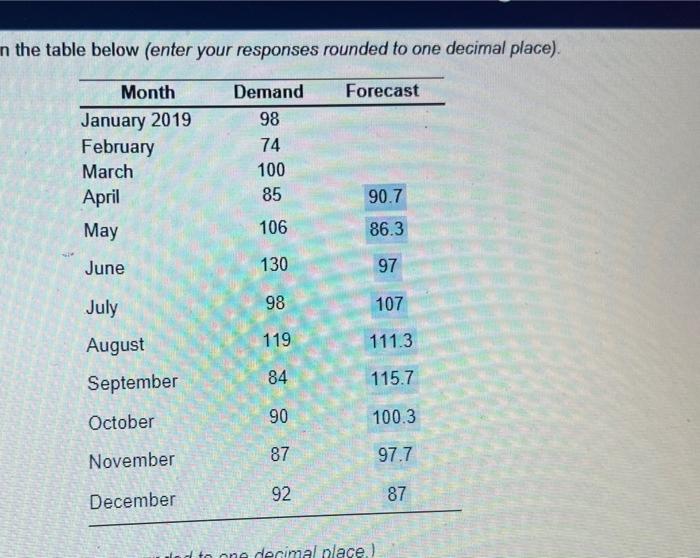
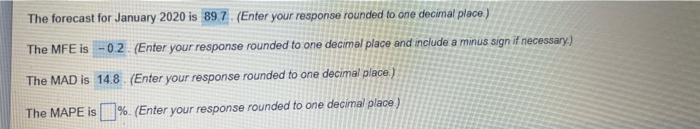
Question: n the table below (enter your responses rounded to one decimal place). Demand Forecast Month January 2019 February March April May 98 74 100 85

n the table below (enter your responses rounded
n the table below (enter your responses rounded to one decimal place). Demand Forecast Month January 2019 February March April May 98 74 100 85 90.7 106 86.3 June 130 97 July 98 107 August 119 111.3 September 84 115.7 October 90 100.3 November 87 97.7 December 92 87 od to one decimal nlace) The forecast for January 2020 is 89 7 (Enter your response rounded to one decimal place) The MFE is -0.2 (Enter your response rounded to one decimal place and include a minus sign if necessary) a The MAD is 14.8 (Enter your response rounded to one decimal place) The MAPE is I % (Enter your response rounded to one decimal place)

Step by Step Solution

There are 3 Steps involved in it

1 Expert Approved Answer
Step: 1 Unlock blur-text-image
Question Has Been Solved by an Expert!

Get step-by-step solutions from verified subject matter experts

Step: 2 Unlock
Step: 3 Unlock

Students Have Also Explored These Related General Management Questions!