

Question: N1. Find the principle components for the stack loss dataset. Which component explains 85% of the variation in the original dataset? [25 pts] N2. Perform
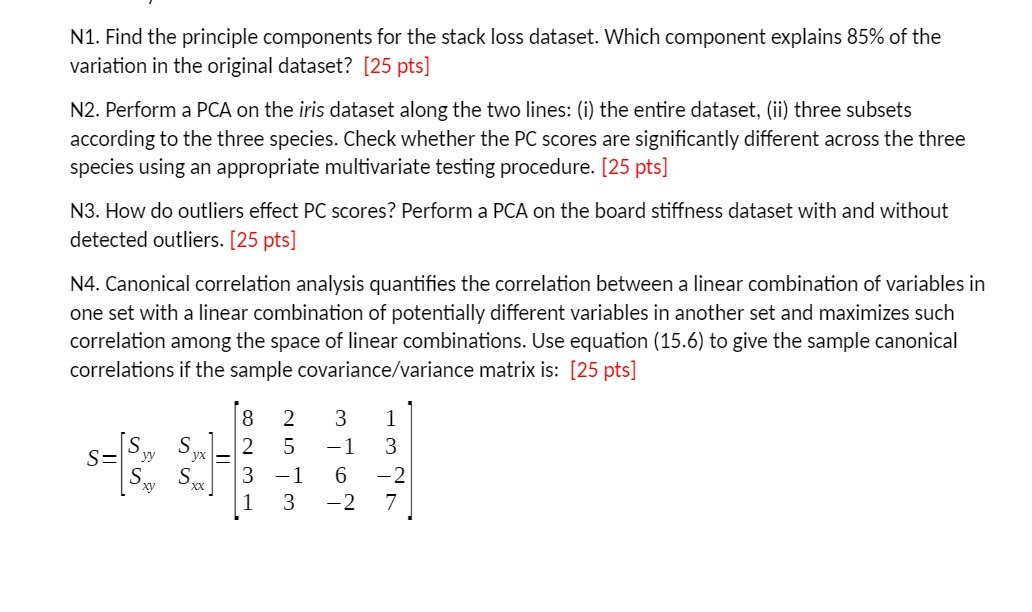
N1. Find the principle components for the stack loss dataset. Which component explains 85% of the variation in the original dataset? [25 pts] N2. Perform a PCA on the iris dataset along the two lines: (i) the entire dataset, (ii) three subsets according to the three species. Check whether the PC scores are significantly different across the three species using an appropriate multivariate testing procedure. [25 pts] N3. How do outliers effect PC scores? Perform a PCA on the board stiffness dataset with and without detected outliers. [25 pts] N4. Canonical correlation analysis quantifies the correlation between a linear combination of variables in one set with a linear combination of potentially different variables in another set and maximizes such correlation among the space of linear combinations. Use equation (15.6) to give the sample canonical correlations if the sample covariance/variance matrix is: [25 pts] N S= Vy VX - S 3 6 2 xy XX 3 N 7
Step by Step Solution
There are 3 Steps involved in it

Get step-by-step solutions from verified subject matter experts