

Question: Naba 1. Enter this data into a blank Google Sheets document. 2. Create a scatter plot. 3. Have the software perform a linear regression to
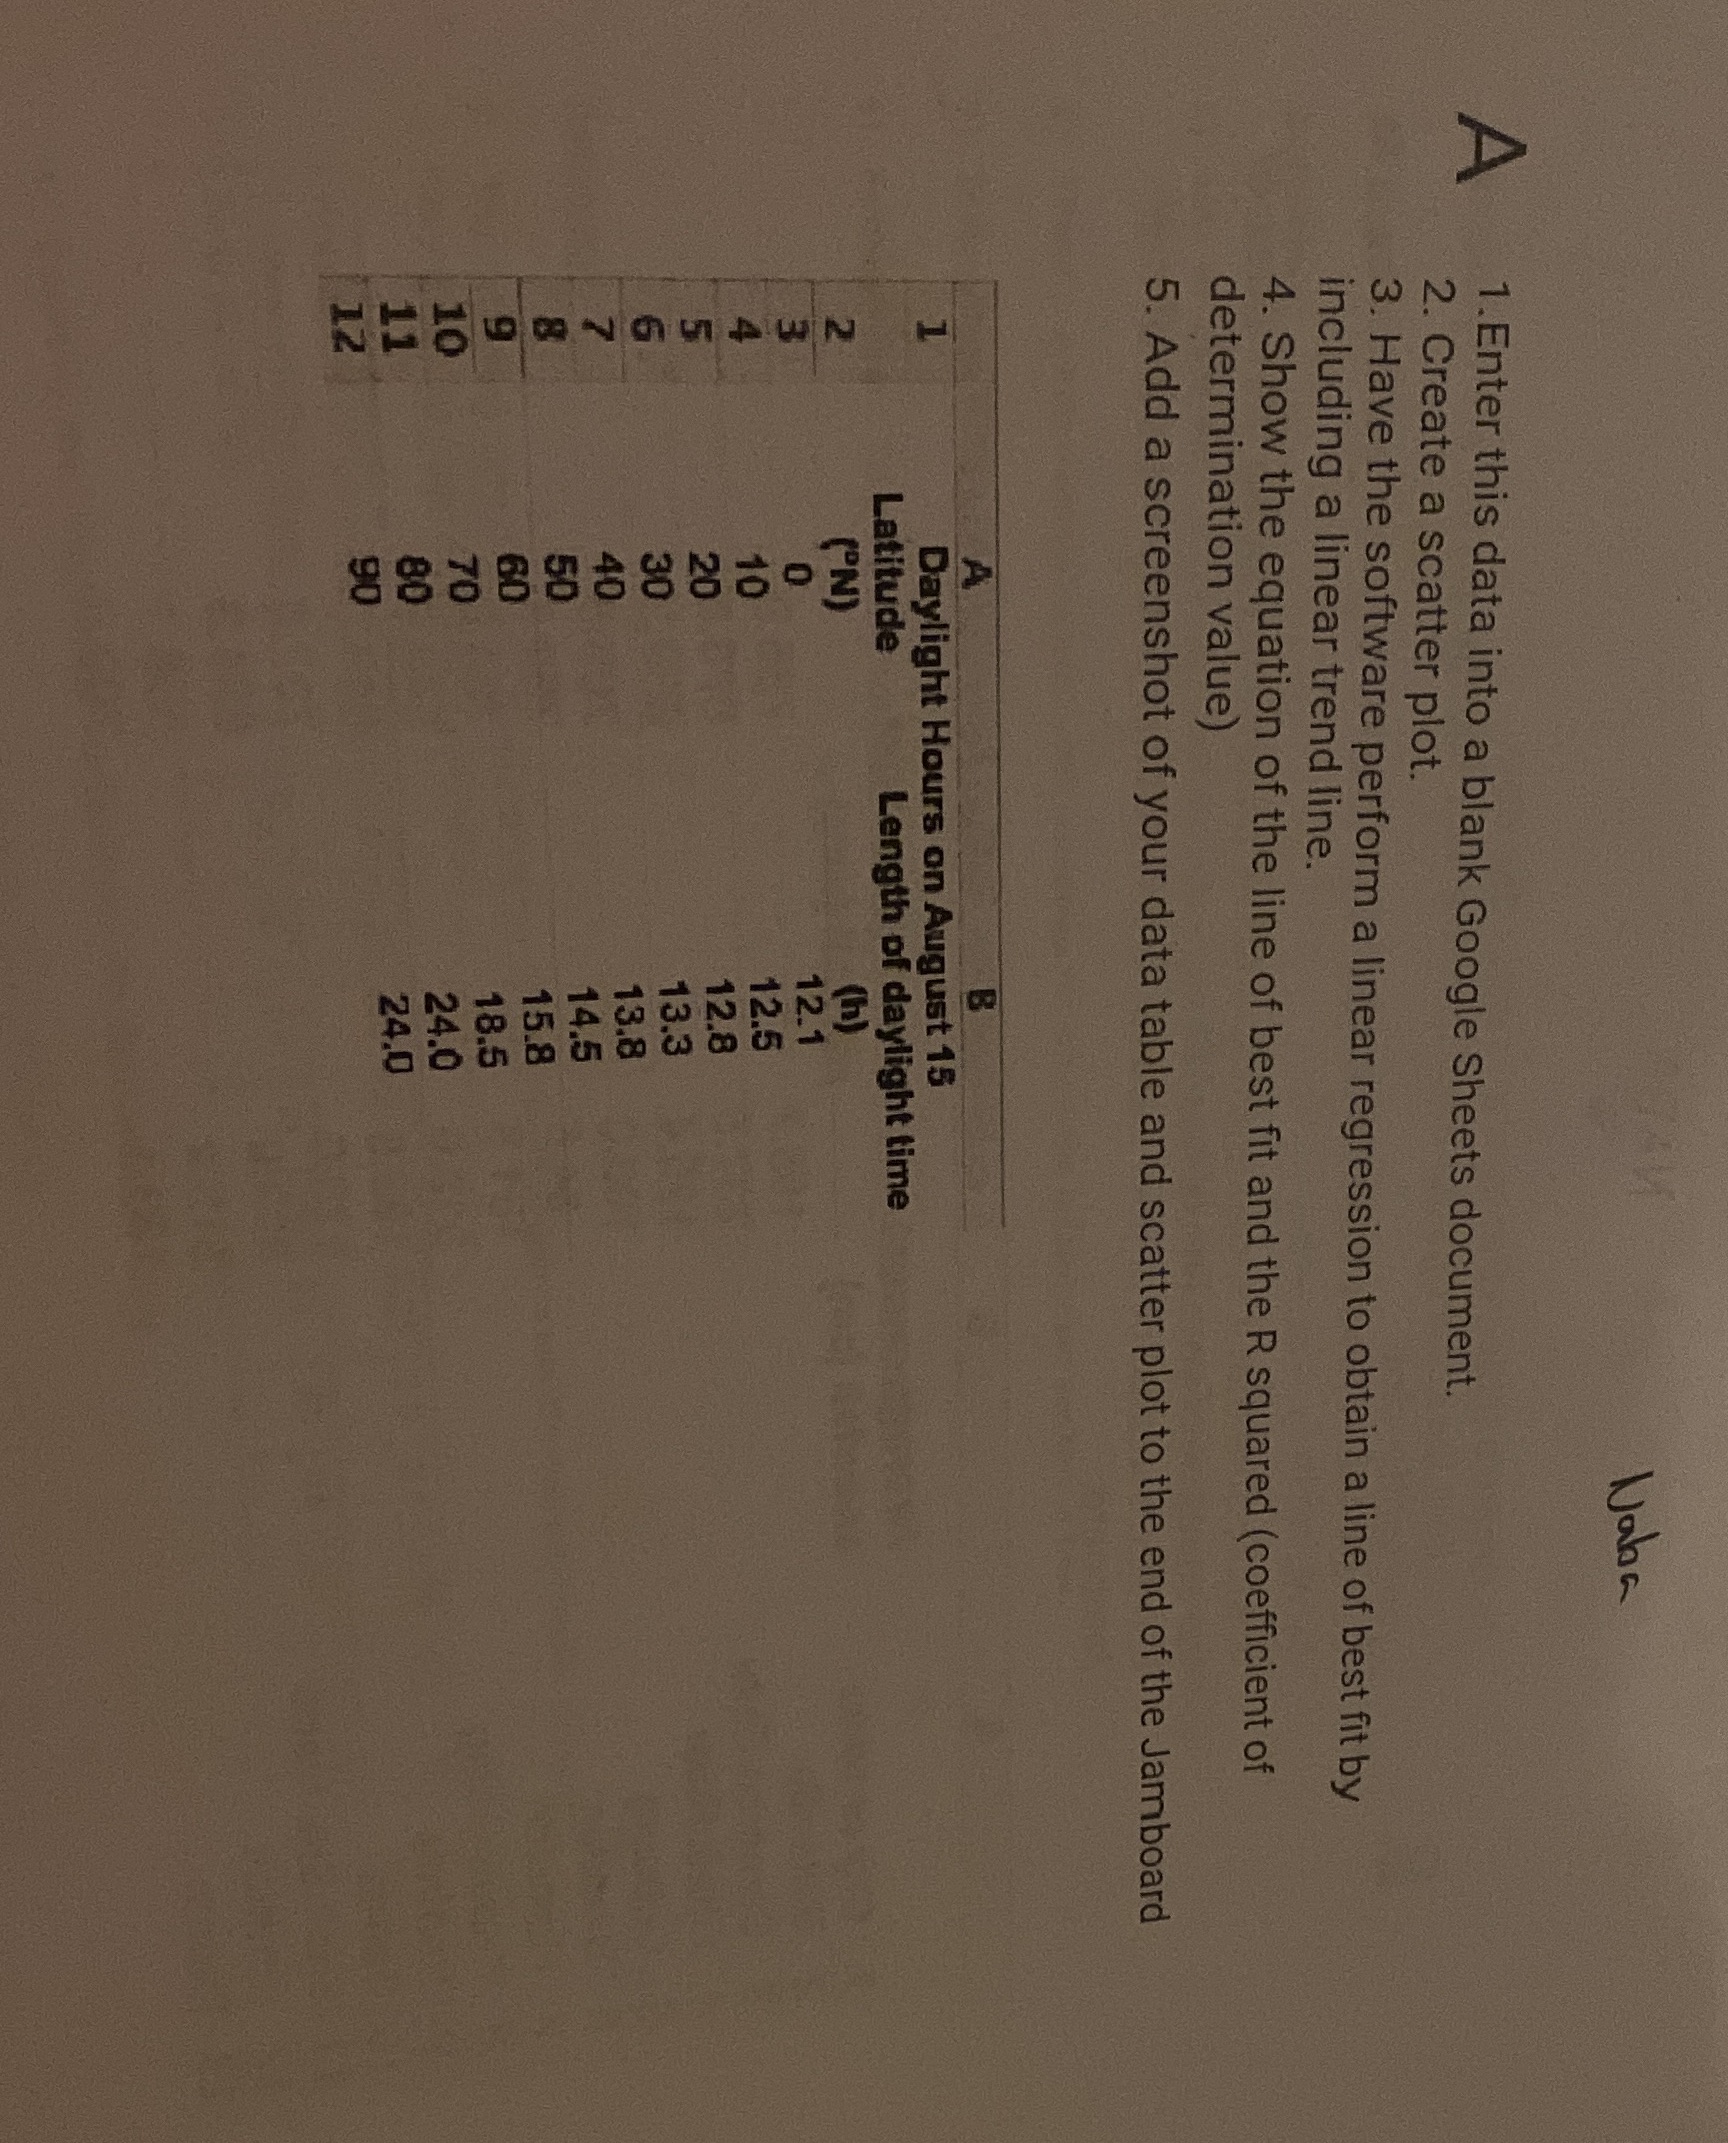
Naba 1. Enter this data into a blank Google Sheets document. 2. Create a scatter plot. 3. Have the software perform a linear regression to obtain a line of best fit by including a linear trend line. 4. Show the equation of the line of best fit and the R squared (coefficient of determination value) 5. Add a screenshot of your data table and scatter plot to the end of the Jamboard Daylight Hours on August 15 Latitude Length of daylight time 12.1 12.5 12.8 13.3 13.8 2-98898 828 8 14.5 15.8 18.5 24.0 24.0
Step by Step Solution
There are 3 Steps involved in it
1 Expert Approved Answer
Step: 1 Unlock

Question Has Been Solved by an Expert!
Get step-by-step solutions from verified subject matter experts
Step: 2 Unlock
Step: 3 Unlock