

Question: Name 1 Data collected during an experiment are shown in the accompanying graph Percent Maximum Activity of Trypsin 100 75 50 25 y 0 X

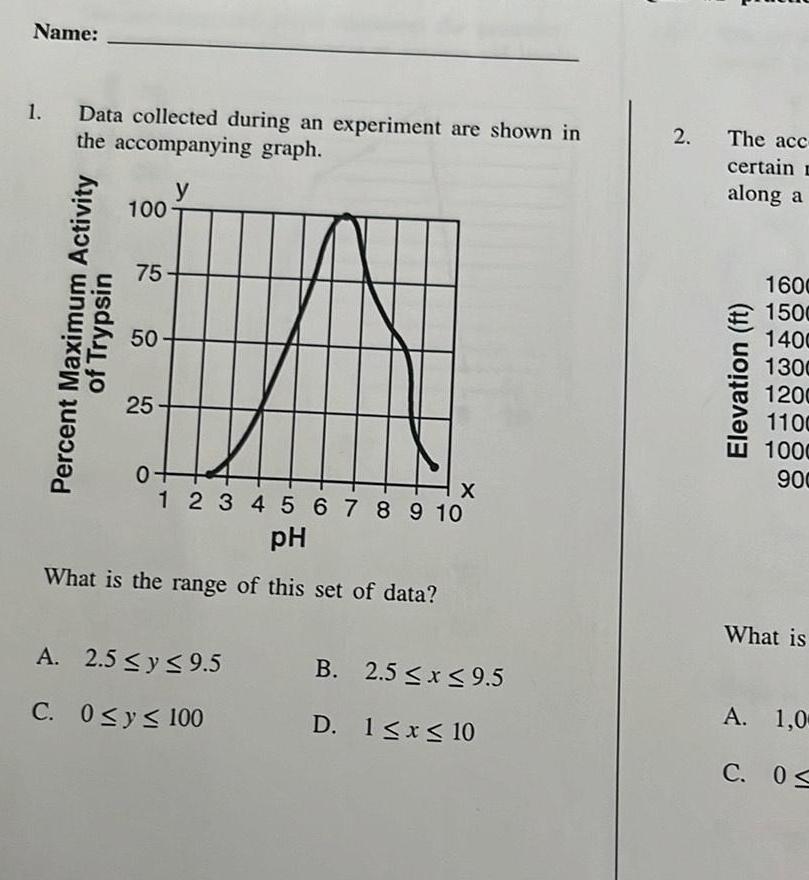
Name 1 Data collected during an experiment are shown in the accompanying graph Percent Maximum Activity of Trypsin 100 75 50 25 y 0 X 1 2 3 4 5 6 7 8 9 10 pH What is the range of this set of data A 2 5 y 9 5 C 0 y 100 B 2 5 x 9 5 D 1 x 10 2 The acc certain D along a Elevation ft 1600 1500 1400 1300 1200 1100 1000 900 What is A 1 0 C 0
Step by Step Solution
There are 3 Steps involved in it
1 Expert Approved Answer
Step: 1 Unlock

Question Has Been Solved by an Expert!
Get step-by-step solutions from verified subject matter experts
Step: 2 Unlock
Step: 3 Unlock