

Question: Name: Date: ASSIGNMENT: RAPHING SHORT-RUN COSTS Curriculum Expectations: explain, using concepts of marginal analysis (e.g., marginal cost, marginal revenue, economies of scale, law of diminishing
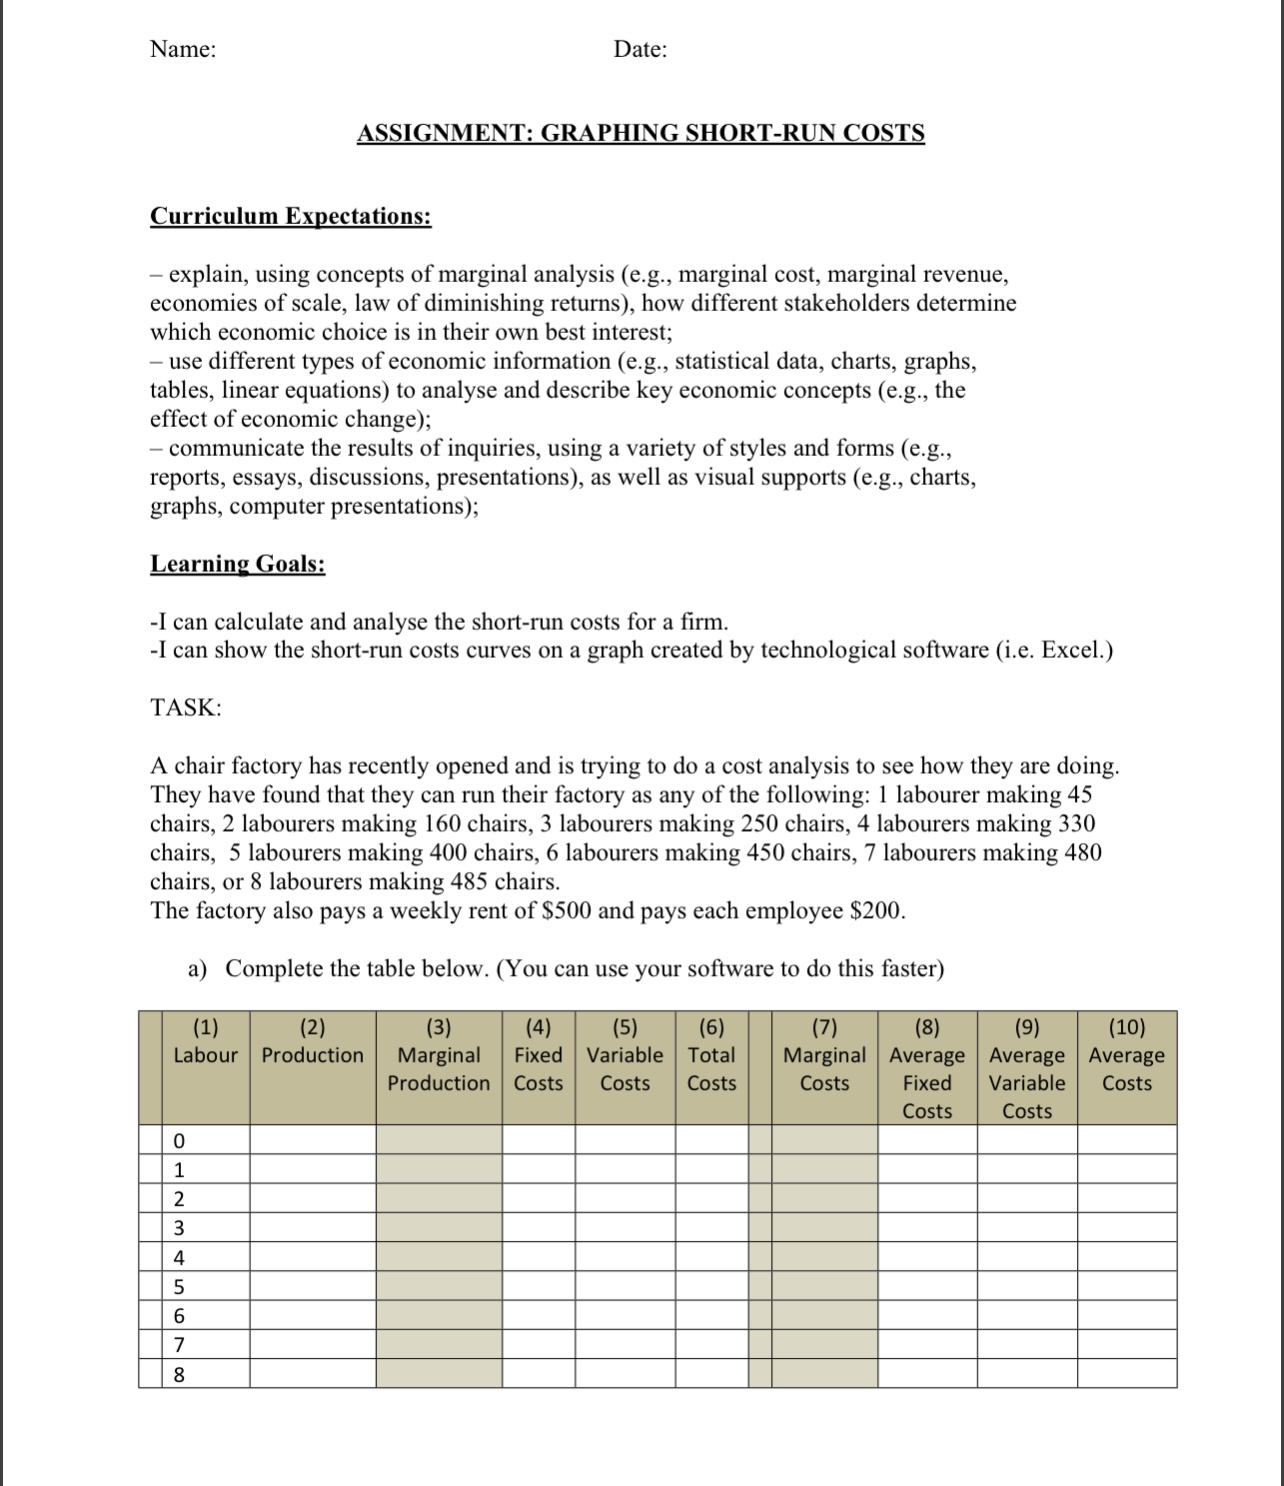


Name: Date: ASSIGNMENT: RAPHING SHORT-RUN COSTS Curriculum Expectations: explain, using concepts of marginal analysis (e.g., marginal cost, marginal revenue, economies of scale, law of diminishing returns), how different stakeholders determine which economic choice is in their own best interest; , use different types of economic information (e.g., statistical data, charts, graphs, tables, linear equations) to analyse and describe key economic concepts (e.g., the effect of economic change); communicate the results of inquiries, using a variety ofstyles and forms (cg, reports, essays, discussions, presentations), as well as visual supports (e.g., charts, graphs, computer presentations); Learning Goals: -1 can calculate and analyse the short-run costs for a rm. -I can show the short-run costs curves on a graph created by technological software (Le. Excel.) TASK: A chair factory has recently opened and is trying to do a cost analysis to see how they are doing. They have found that they can run their factory as any ofthe following: 1 labourer making 45 chairs, 2 labourers making 160 chairs, 3 labourers making 250 chairs, 4 labourers making 330 chairs, 5 labourers making 400 chairs, 6 labourers making 450 chairs, 7 labourers making 480 chairs, or 8 labourers making 485 chairs. The factory also pays a weekly rent of $500 and pays each employee $200. a) Complete the table below. (You can use your software to do this faster) (2) (3) l6) (7} Production Marginal Fixed Variable Total Marginal Average Average Average Production Costs Costs Costs IE- I- 2 I. 4 I- 6 I. 8 b) Using technological software, graph the AFC, AVC, AC, and MC. Save your graph. Insert your Table and graph in the space below. c) At approximately what point does MC intersect with AC? What does this point represent? (2 marks. 17]) d) If each chair was sold at a price of $4.00, what would be the prot (or loss) earned by the factory? (3 marks. 17!) Submit this completed document to the Canvas post for this assignment. as a PDF le. REFLECTION: Overall. how do you feel you did on this task (mark one): Level 1: (50-60%) Level 2: (6070%) Level 3: (70-80%) Level 4: (SO-100%) Describe any challenges that you had when: Calculating- Graphing- Outline 3 steps that you can take to ensure that you will be ready for a similar type ofquestion (with manual graphing) on a quiz, test, exam, etc.: 1. 2
Step by Step Solution
There are 3 Steps involved in it

Get step-by-step solutions from verified subject matter experts