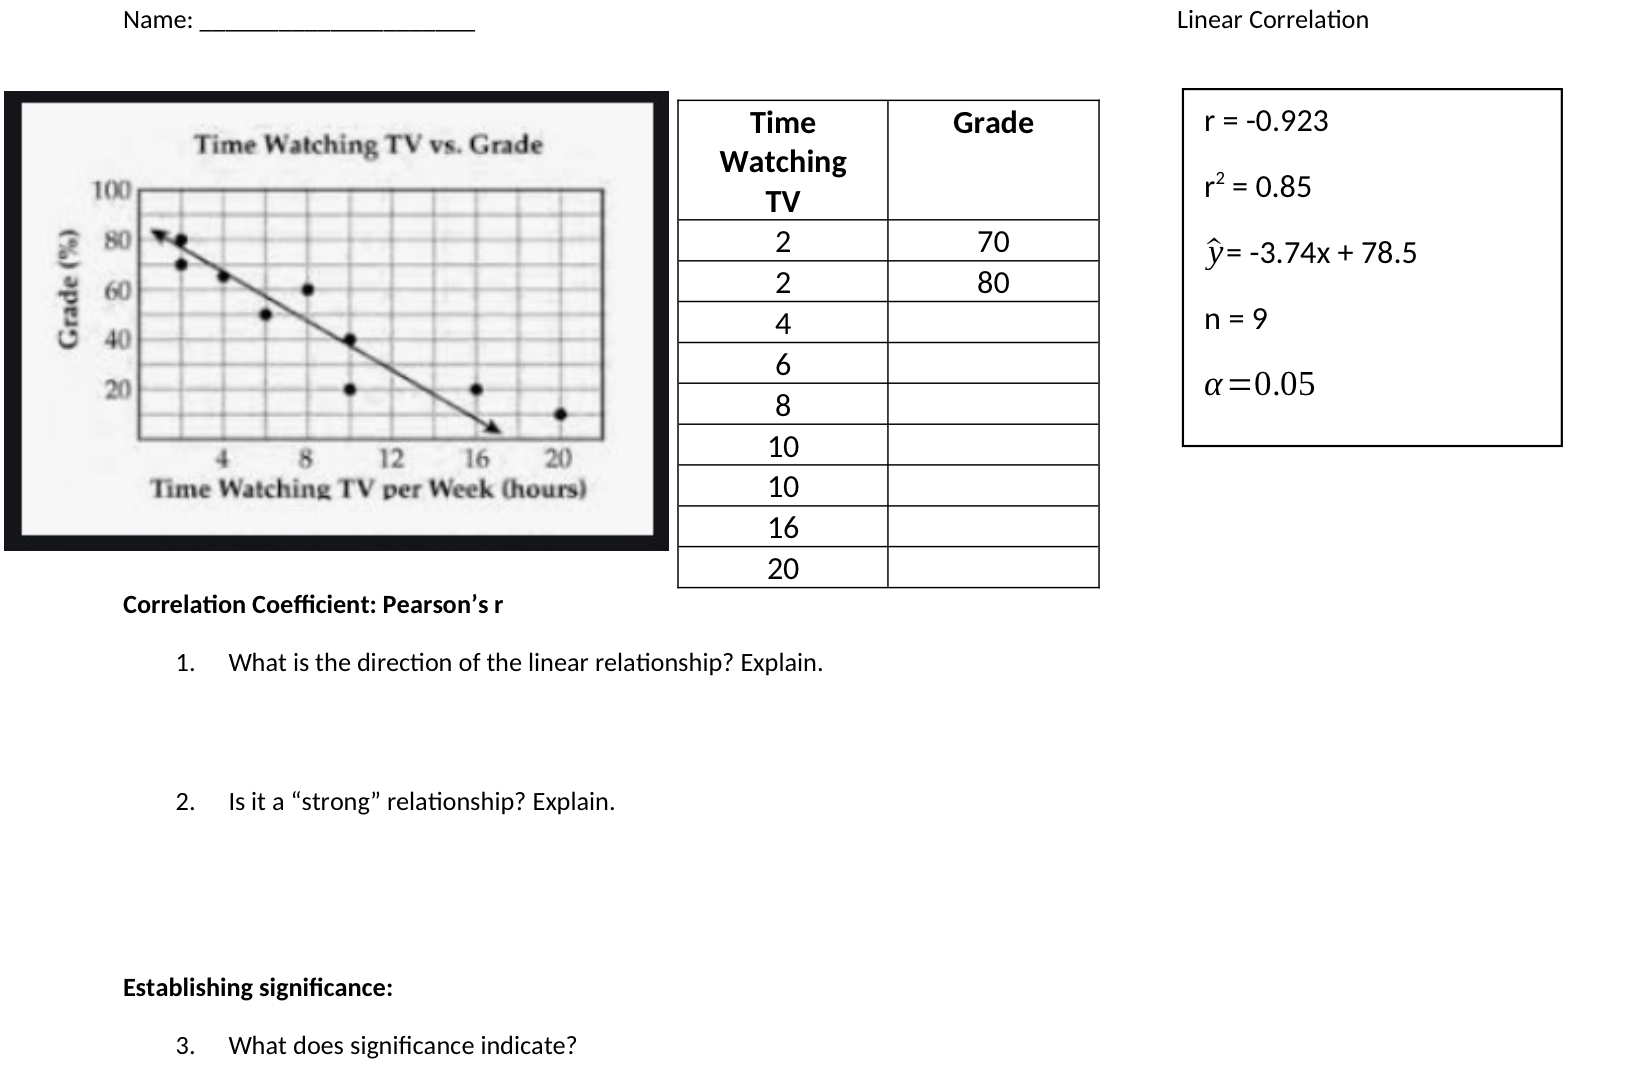
Question: Name: Linear Correlation Time Grade r = -0.923 Time Watching TV vs. Grade Watching 100 TV r2 = 0.85 80 IN 70 y= -3.74x +

Name: Linear Correlation Time Grade r = -0.923Name: Linear Correlation Time Grade r = -0.923Name: Linear Correlation Time Grade r = -0.923Name: Linear Correlation Time Grade r = -0.923Name: Linear Correlation Time Grade r = -0.923
Name: Linear Correlation Time Grade r = -0.923 Time Watching TV vs. Grade Watching 100 TV r2 = 0.85 80 IN 70 y= -3.74x + 78.5 Grade (%) 60 2 80 4 n = 9 6 20 a =0.05 8 12 16 20 10 Time Watching TV per Week (hours) 10 16 20 Correlation Coefficient: Pearson's r 1. What is the direction of the linear relationship? Explain. 2. Is it a "strong" relationship? Explain. Establishing significance: 3. What does significance indicate?Establishing significance: 3. What does significance indicate? Critical Values for Pearson Correlation 4. Does the initial value of r indicate significance? Coefficient The correlation is significant when the absolute value of r is greater than the value in the table. 5. What does the alpha level represent? n a@ = 0.05 a = 0.01 4 0.950 0.990 5 0.878 0.959 6 0.811 0.917 6. Use the table to determine if r = -0.923, n = 9 for alpha = 0.05 " 0.754 0.875 is significant. 8 0.707 0.834 9 0.666 0.798 State your findings. 10 0.632 0.765 11 0.602 0.735 12 0.576 0.708 13 0.553 0.684 14 0.532 0.661 15 0.514 0.641 The Coefficient of Determination: R' is a measure that represents the proportion of the variance for a response/dependent variable that is explained by an explanatory/independent variable. 1. The proportion of variance for that is explained by is . Response variable explanatory variable value of R? 2. Since total variance adds up to , then the proportion of the variance that is unaccounted for is 3. What are some other variables or factors that affect academic performance? Draw a pie chart. EXPLANATORY or INDEPENDENT VARIABLES RELATIVE FREQUENCY NUMBER OF HOURS SPENT WATCHING TV 0.85 TOTAL Using the Line of Best Fit to PREDICT 1. Using the Prediction Equation, Calculate the predicted value for x = 12 Y=-3.74x + 78.5 2. Where will all predicted values fall on the graph? 2: Where will all predicted values fall on the graph? Residuals and Error: Actual y value - Predicted y value 1. Calculating the Residual: 2. Identify the actual y-value when x = 6 Calculate the predicted y-value for x = 6. Calculate: Residual = Actual y - Predicted y What does a negative residual indicate? ACTUAL Predicted Residual x y-value y-value (error) 6 50 Grade (%) Time Watching TV vs. Grade 12 Time Watching TV per Week (hours) 20) What does a positive residual indicate

Step by Step Solution

There are 3 Steps involved in it

1 Expert Approved Answer
Step: 1 Unlock blur-text-image
Question Has Been Solved by an Expert!

Get step-by-step solutions from verified subject matter experts

Step: 2 Unlock
Step: 3 Unlock

Students Have Also Explored These Related Mathematics Questions!