

Question: Name: Math 133: 3.3 Worksheet #2 Section #: 3.3: Measures of Central Tendency and Dispersion for Grouped Data 1. Suppose a statistics course has the
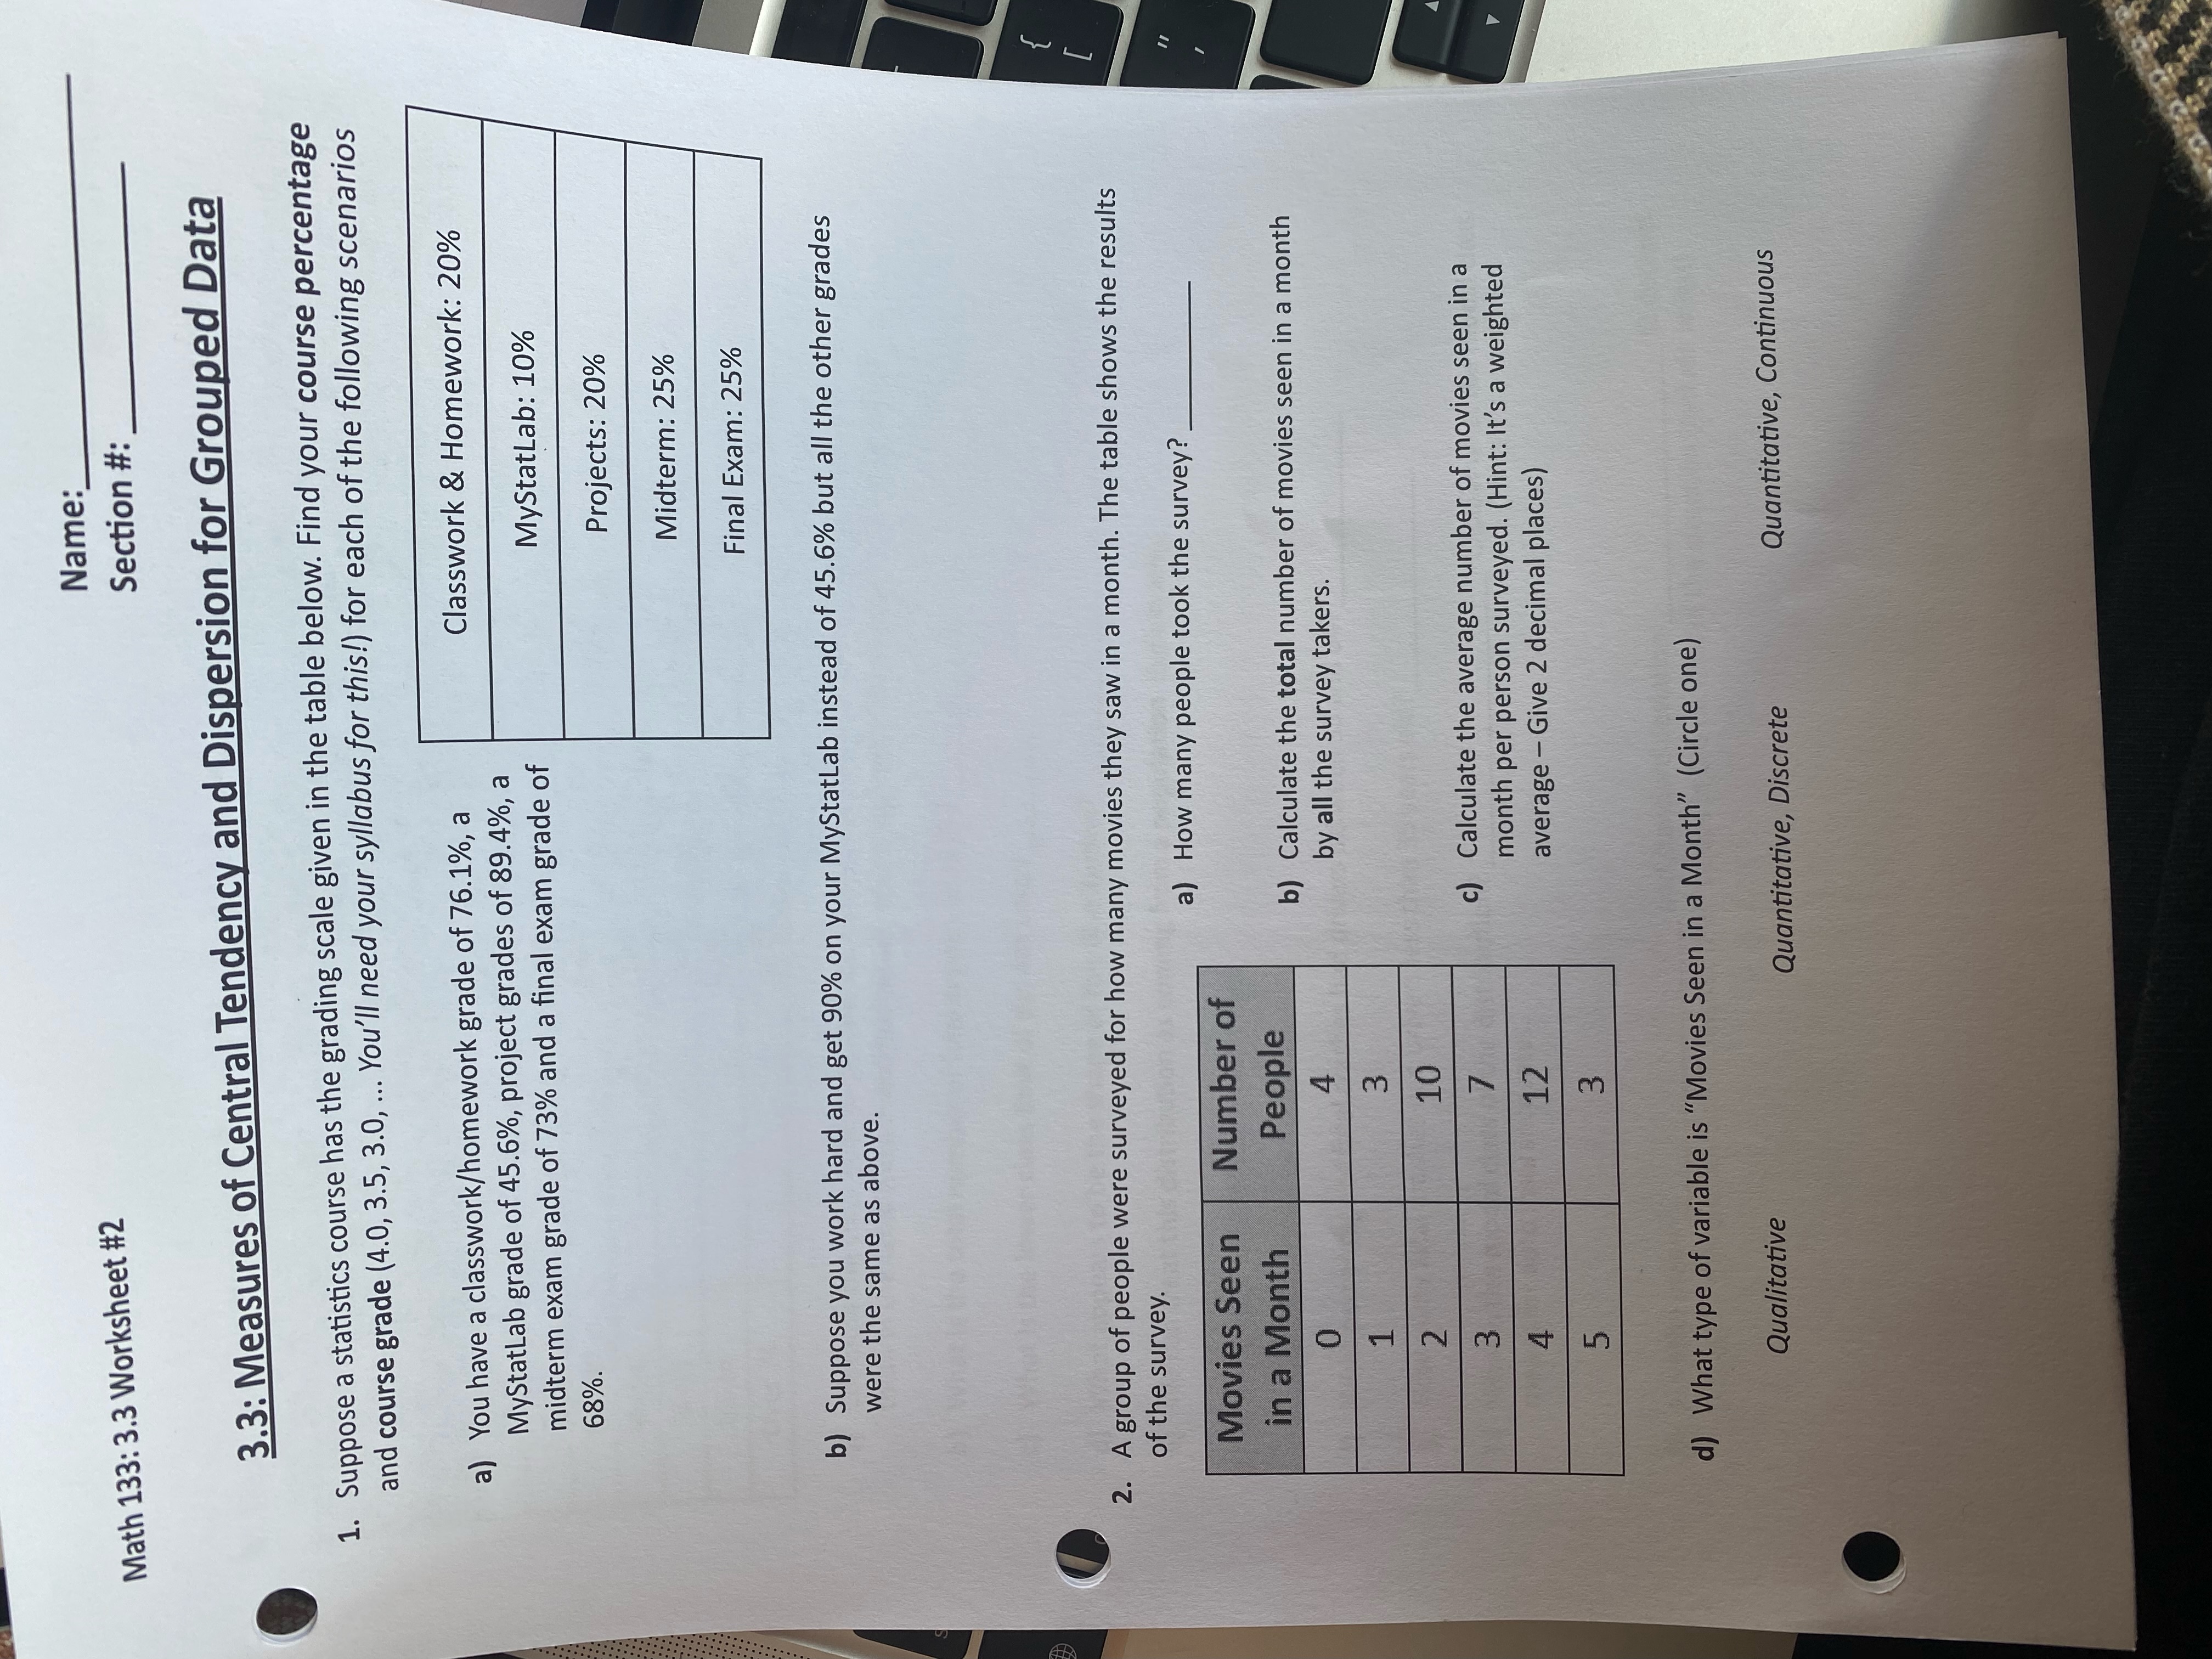
Name: Math 133: 3.3 Worksheet #2 Section #: 3.3: Measures of Central Tendency and Dispersion for Grouped Data 1. Suppose a statistics course has the grading scale given in the table below. Find your course percentage and course grade (4.0, 3.5, 3.0, ... You'll need your syllabus for this!) for each of the following scenarios a) You have a classwork/homework grade of 76.1%, a Classwork & Homework: 20% MyStatLab grade of 45.6%, project grades of 89.4%, a midterm exam grade of 73% and a final exam grade of MyStatLab: 10% 68%. Projects: 20% Midterm: 25% Final Exam: 25% b) Suppose you work hard and get 90% on your MyStatLab instead of 45.6% but all the other grades were the same as above. 2. A group of people were surveyed for how many movies they saw in a month. The table shows the results of the survey. a) How many people took the survey? Movies Seen Number of in a Month People b) Calculate the total number of movies seen in a month 0 4 by all the survey takers. 1 3 2 10 3 7 c) Calculate the average number of movies seen in a month per person surveyed. (Hint: It's a weighted 4 12 average - Give 2 decimal places) 5 3 d) What type of variable is "Movies Seen in a Month" (Circle one) Qualitative Quantitative, Discrete Quantitative, Continuous
Step by Step Solution
There are 3 Steps involved in it

Get step-by-step solutions from verified subject matter experts