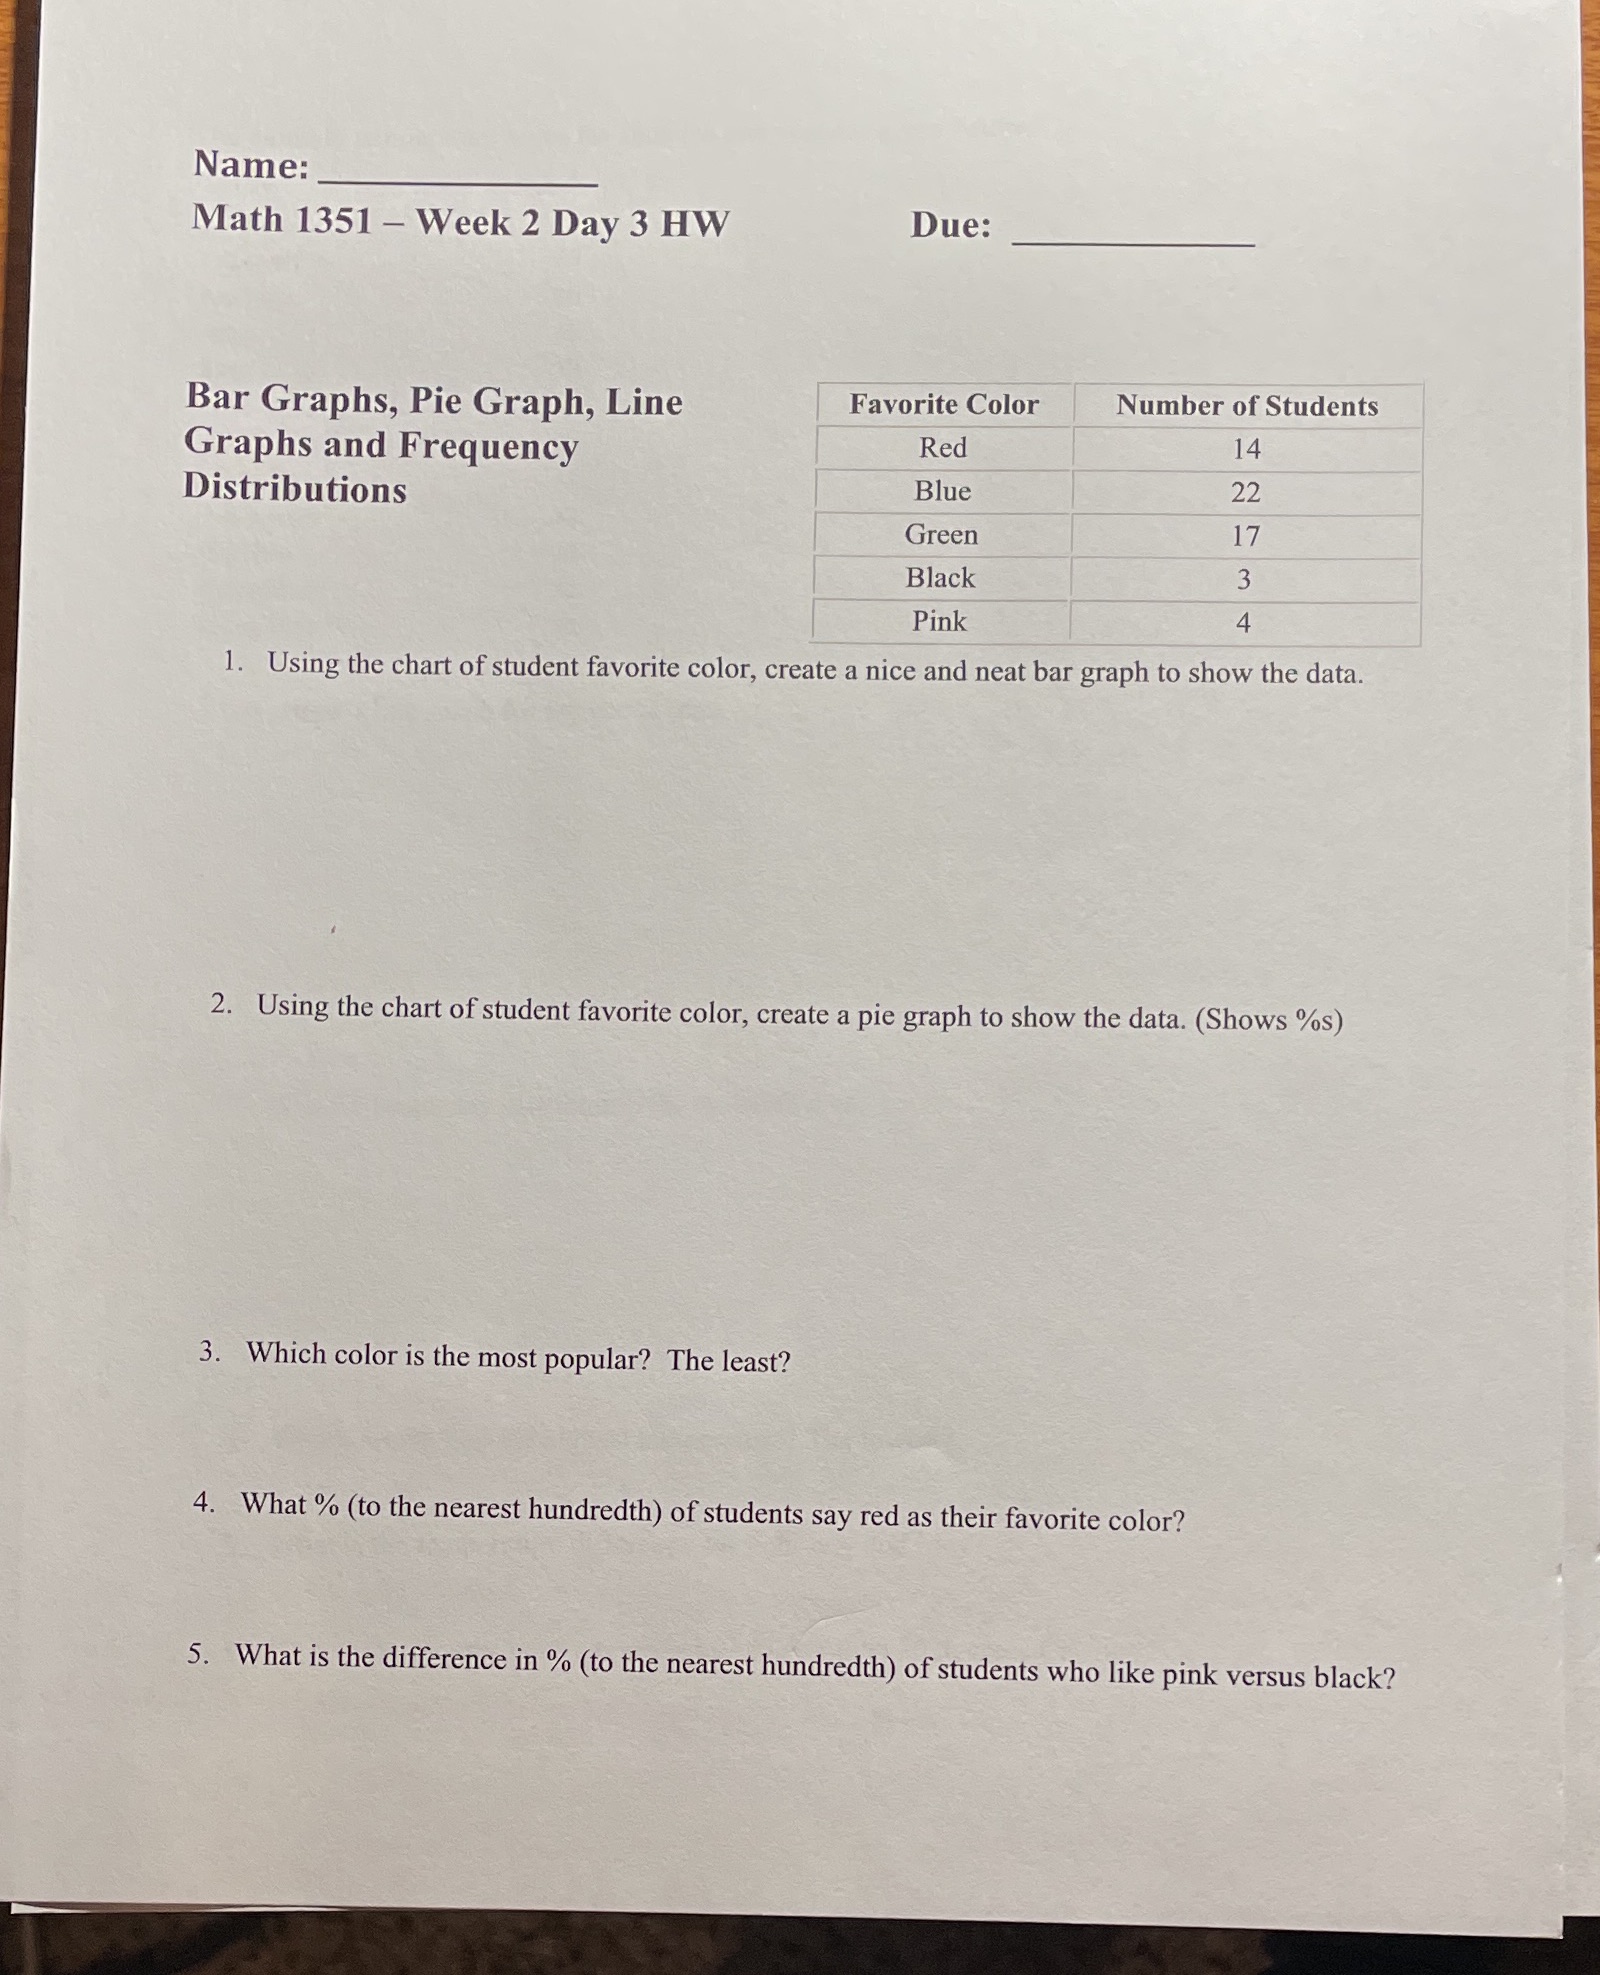
Question: Name: Math 1351 - Week 2 Day 3 HW Due: Bar Graphs, Pie Graph, Line Favorite Color Number of Students Graphs and Frequency Red 14

Name: Math 1351 - Week 2 Day 3 HW Due: Bar
Name: Math 1351 - Week 2 Day 3 HW Due: Bar Graphs, Pie Graph, Line Favorite Color Number of Students Graphs and Frequency Red 14 Distributions Blue 22 Green 17 Black 3 Pink 4 1. Using the chart of student favorite color, create a nice and neat bar graph to show the data. 2. Using the chart of student favorite color, create a pie graph to show the data. (Shows %s) 3. Which color is the most popular? The least? 4. What % (to the nearest hundredth) of students say red as their favorite color? 5. What is the difference in % (to the nearest hundredth) of students who like pink versus black

Step by Step Solution

There are 3 Steps involved in it

1 Expert Approved Answer
Step: 1 Unlock blur-text-image
Question Has Been Solved by an Expert!

Get step-by-step solutions from verified subject matter experts

Step: 2 Unlock
Step: 3 Unlock

Students Have Also Explored These Related Mathematics Questions!