

Question: Name: Period: Assessing Elephant Populations: Using geographic data At the right, you see two maps of the Tsavo region in Kenya. The top includes
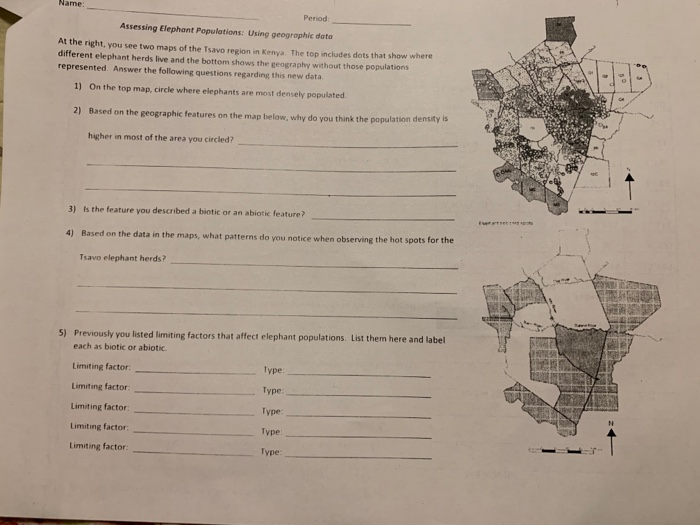
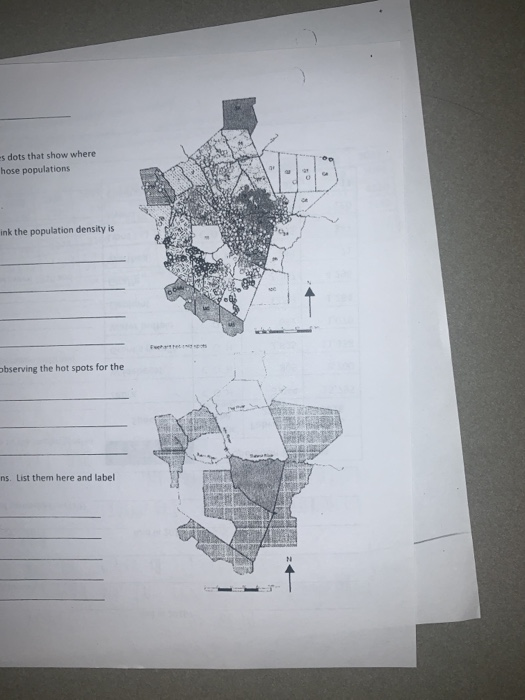
Name: Period: Assessing Elephant Populations: Using geographic data At the right, you see two maps of the Tsavo region in Kenya. The top includes dots that show where different elephant herds live and the bottom shows the geography without those populations represented. Answer the following questions regarding this new data 1) On the top map, circle where elephants are most densely populated. 2) Based on the geographic features on the map below, why do you think the population density is higher in most of the area you circled? 3) Is the feature you described a biotic or an abiotic feature? 4) Based on the data in the maps, what patterns do you notice when observing the hot spots for the Tsavo elephant herds? 5) Previously you listed limiting factors that affect elephant populations. List them here and label. each as biotic or abiotic. Limiting factor: Limiting factor: Limiting factor: Limiting factor: Limiting factor: Type. Type: Type: Type: Type: How es dots that show where hose populations ink the population density is observing the hot spots for the ns. List them here and label. af 30p
Step by Step Solution
3.36 Rating (159 Votes )
There are 3 Steps involved in it
1 The picture above shows the place where there are the most elephants And the green circle shows wh... View full answer

Get step-by-step solutions from verified subject matter experts