

Question: Name: q , 2 4 Fa Macro Final q , Exhibit 2 - 6 Production possibilities curve data table [ [ , A ,
Name:
Fa Macro Final
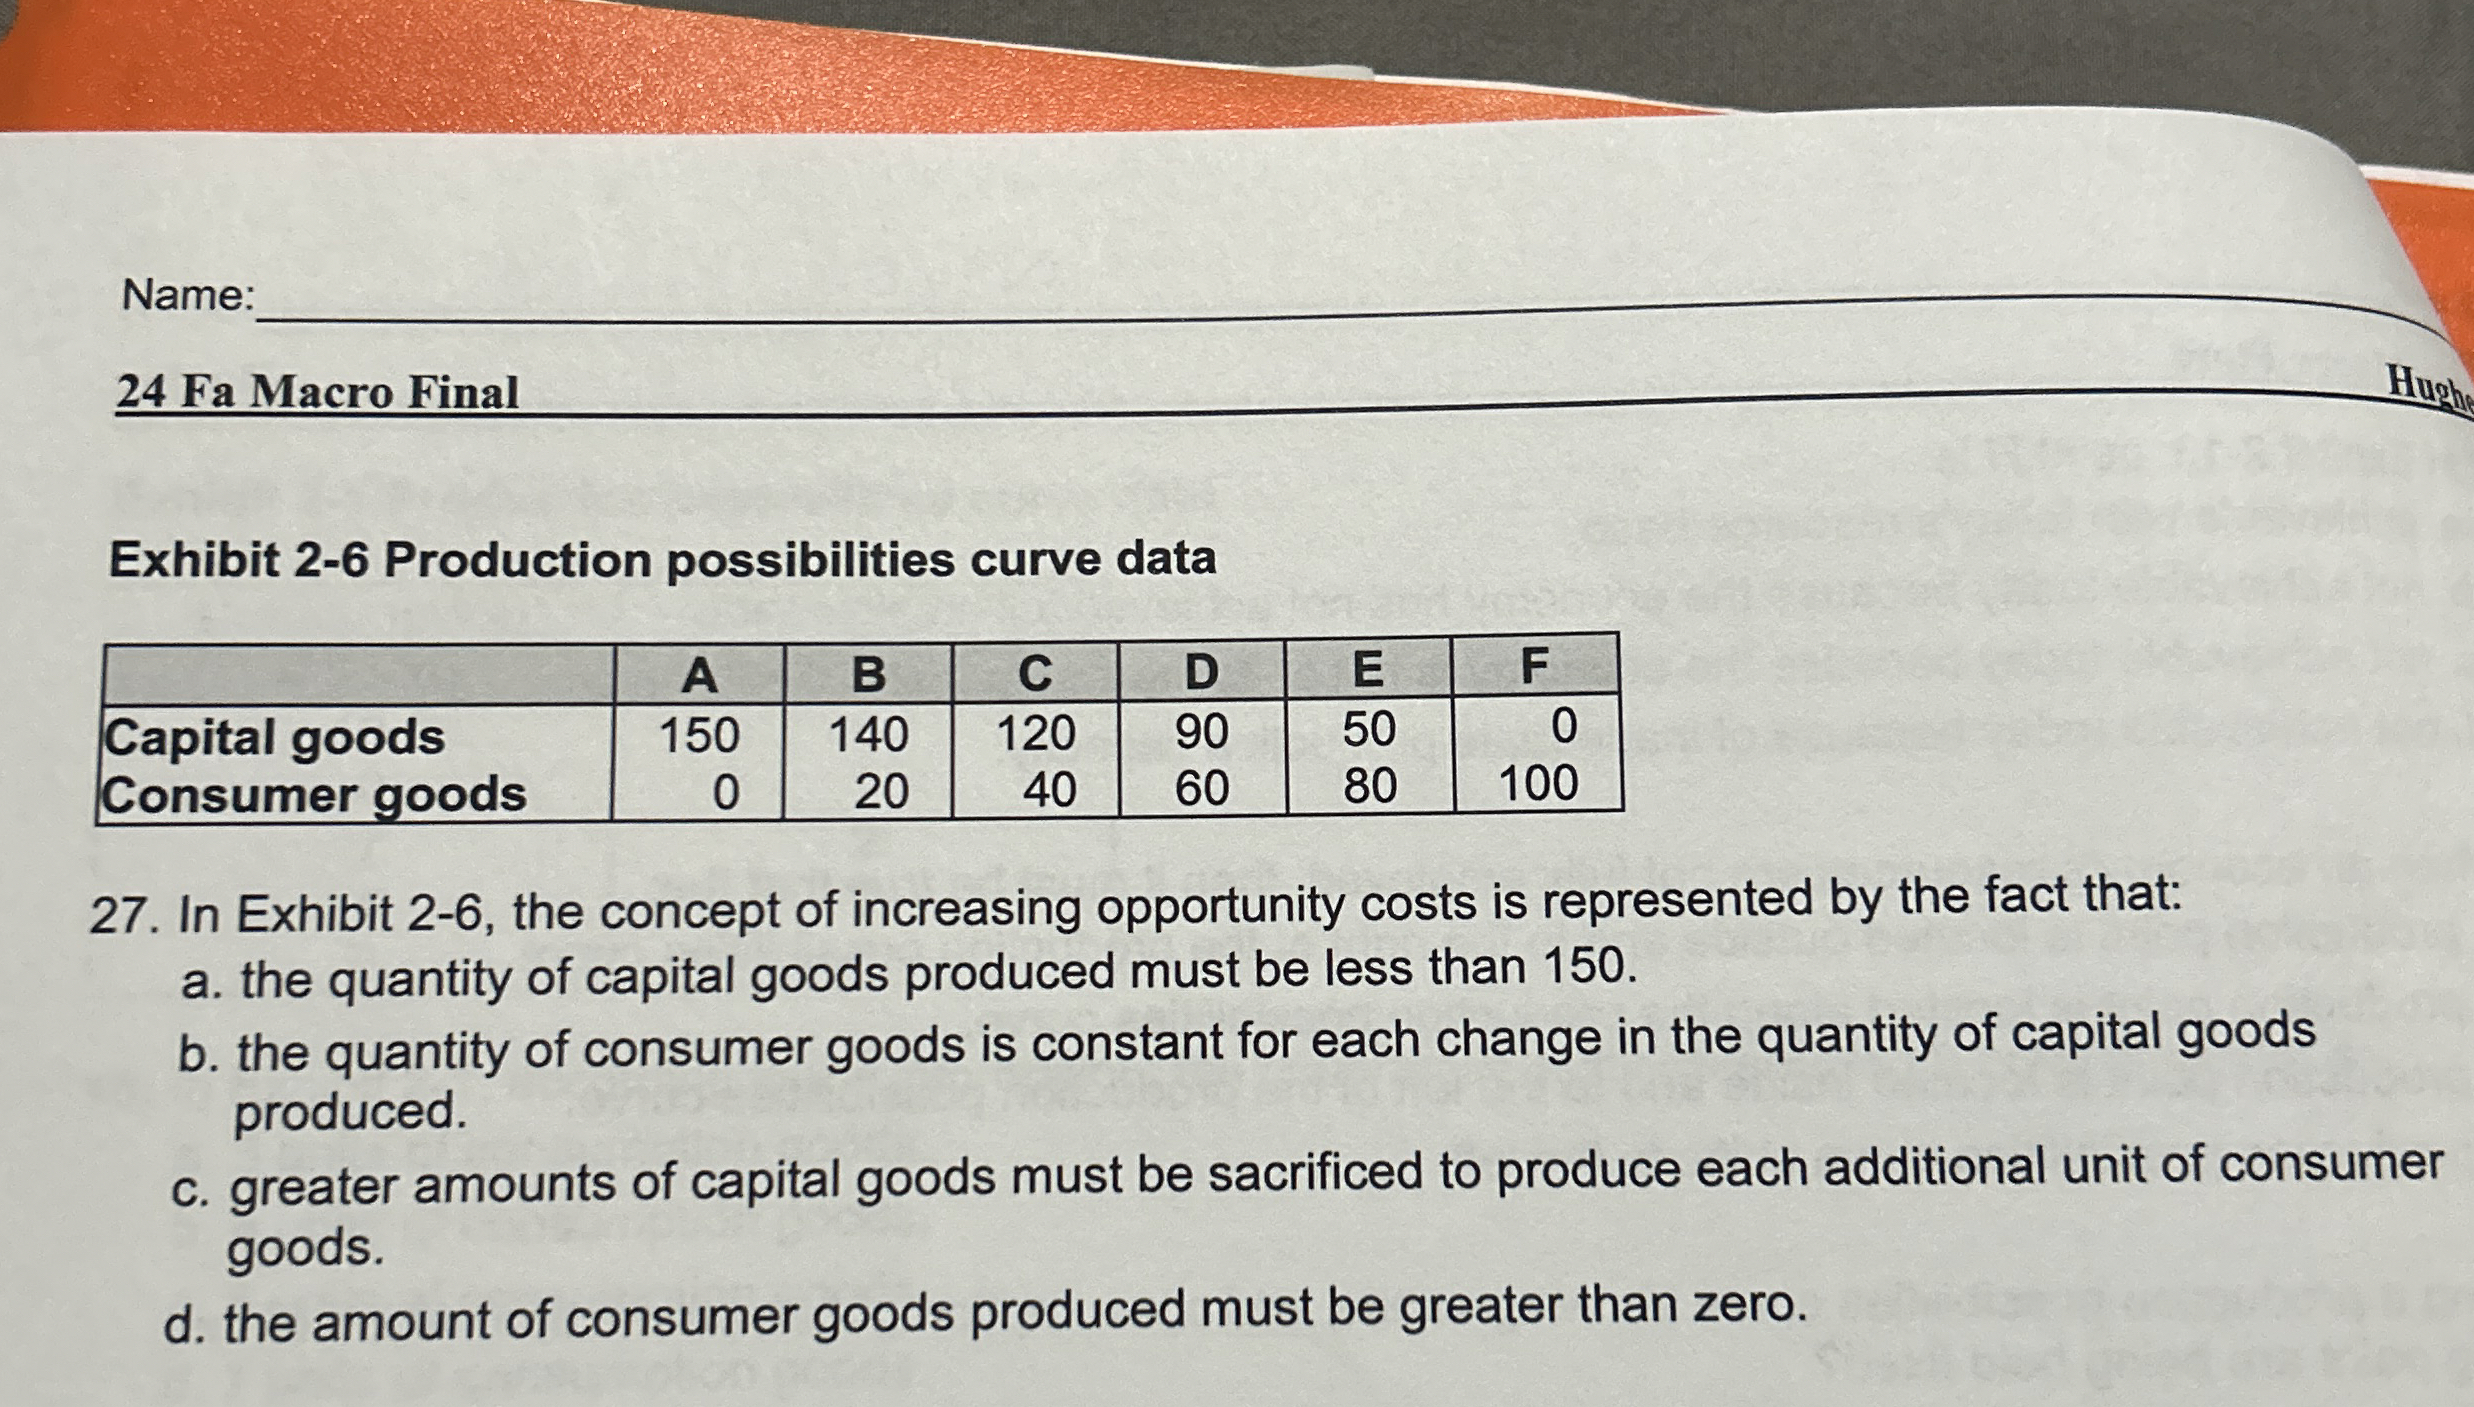
Exhibit Production possibilities curve data
tableABCDEFCapital goods,Consumer goods,
In Exhibit the concept of increasing opportunity costs is represented by the fact that:
a the quantity of capital goods produced must be less than
b the quantity of consumer goods is constant for each change in the quantity of capital goods produced.
c greater amounts of capital goods must be sacrificed to produce each additional unit of consumer goods.
d the amount of consumer goods produced must be greater than zero.
Step by Step Solution
There are 3 Steps involved in it
1 Expert Approved Answer
Step: 1 Unlock

Question Has Been Solved by an Expert!
Get step-by-step solutions from verified subject matter experts
Step: 2 Unlock
Step: 3 Unlock