Question: NAME: SHOW ALL WORK! . An executive interested in Cutting costs does a study on the weekly cost of heating the company's building to different
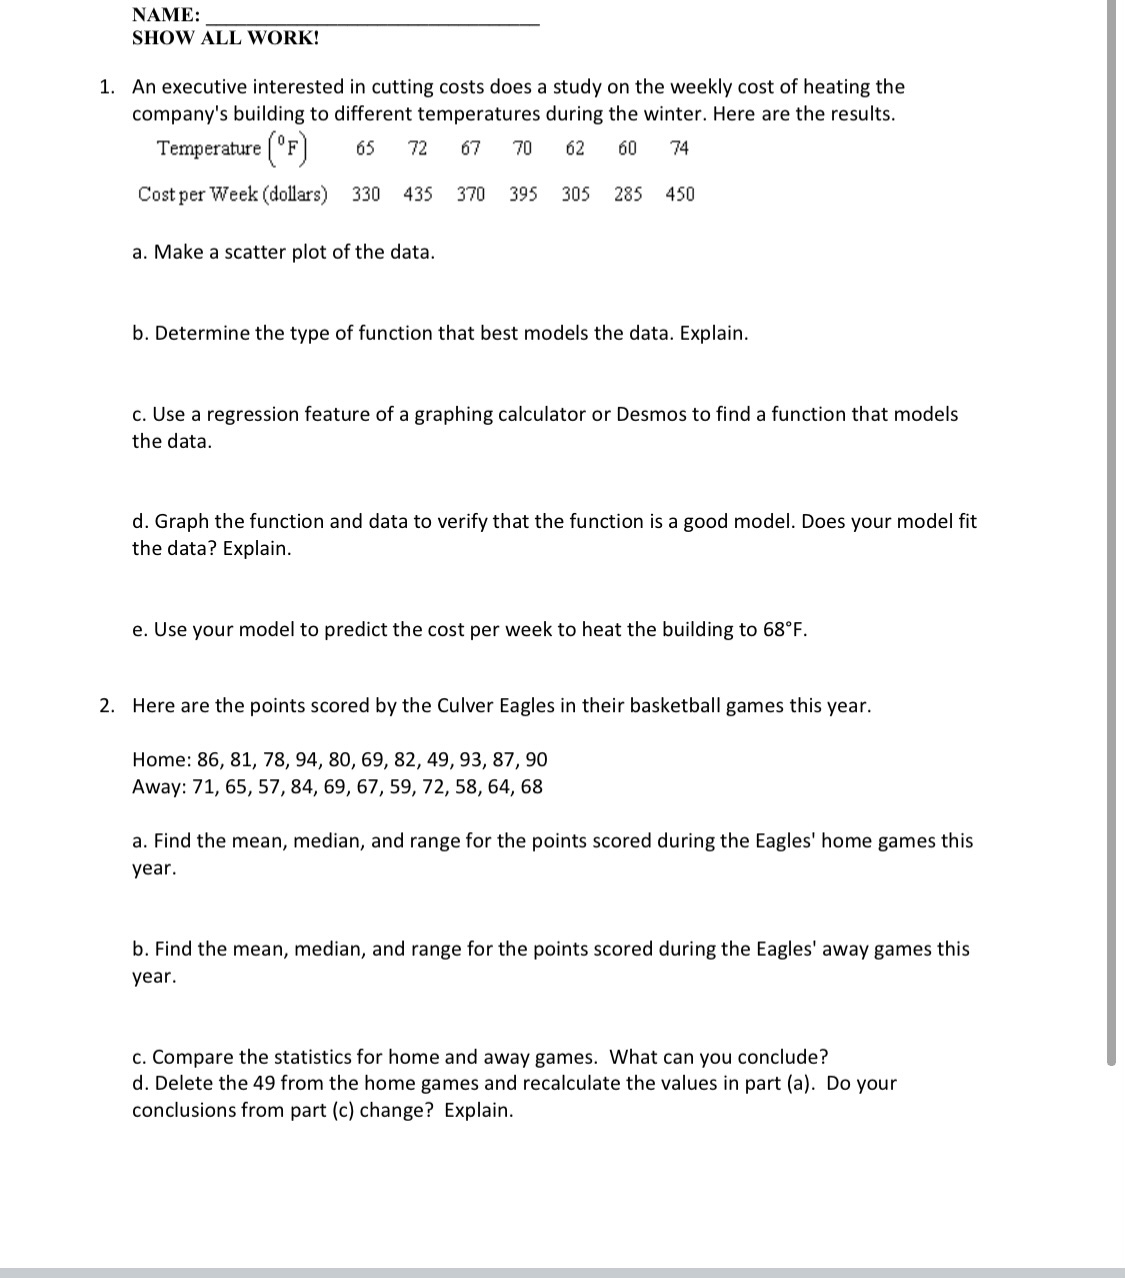
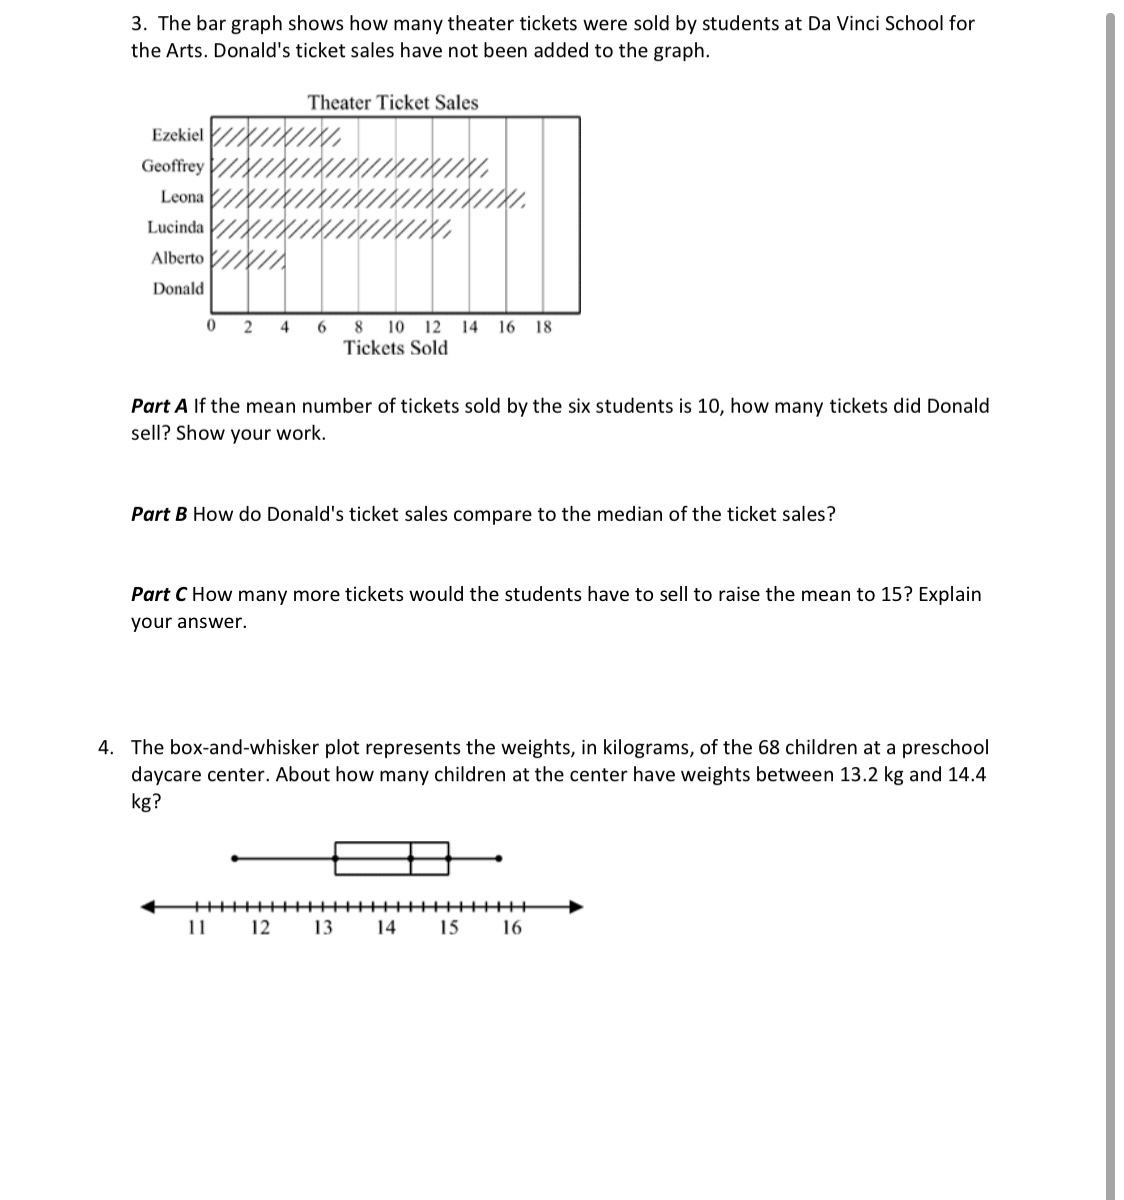
NAME: SHOW ALL WORK! . An executive interested in Cutting costs does a study on the weekly cost of heating the company's building to different temperatures during the winter. Here are the results. Tentperam[F) as 72 a? "m 62 an 74 CostperWeek(dolIars) 330 435 370 395 305 235 450 a. Make a scatter plot ofthe data. b. Determine the type of function that best models the data. Explain. c. Use a regression feature of a graphing calculator or Desmos to find a function that models the data. d. Graph the function and data to verify that the function is a good model. Does your model t the data? Explain. e. Use your model to predict the cost per week to heat the building to 68F. Here are the points scored by the Culver Eagles in their basketball games this year. Home: 86, 81, 78, 94, 80, 69, 82, 49, 93, 87, 90 Away: 71, 65, S7, 84, 69, 67, 59, 72, 58, 64, 68 a. Find the mean, median, and range for the points scored during the Eagles' home games this yean b. Find the mean, median, and range for the points scored during the Eagles' away games this year. c. Compare the statistics for home and away games. What can you conclude? d. Delete the 49 from the home games and recalculate the values in part (a). Do your conclusions from part (c) change? Explain. 3. The bar graph shows how many theater tickets were sold by students at Da Vinci School for the Arts. Donald's ticket sales have not been added to the graph. Theater Ticket Sales Ezekiel / x 0.0m / //;'///// / 1mm / /////// / Lucinda // //////// 1 Alberto Donald / /A 41613 PartA If the mean number of tickets sold by the six students is 10, how many tickets did Donald sell? Sh ow your work. 0' 2 4 6 8 1012 1 TickelsSold Part B How do Donald's ticket sales compare to the median of the ticket sales? Part C How many more tickets would the students have to sell to raise the mean to 15? Explain your answer. 4. The box-and-whisker plot represents the weights, in kilograms, of the 68 children at a preschool daycare center. About how many children at the center have weights between 13.2 kg and 14.4 kg? 4l-l-l-l-l-l-l-I-l-I-H-I-H-H-H-l-l-I-H-I-l-Ib ll I2 l3 M 15 16
Step by Step Solution
There are 3 Steps involved in it
1 Expert Approved Answer
Step: 1 Unlock
Question Has Been Solved by an Expert!
Get step-by-step solutions from verified subject matter experts
Step: 2 Unlock
Step: 3 Unlock
Students Have Also Explored These Related Mathematics Questions!