

Question: Name(s): Date Due: April 23, 2020 Math 1060 LINEAR PROGRAMMING PROJECT You are the new owner of a music shop in Greenwood. Your first duty

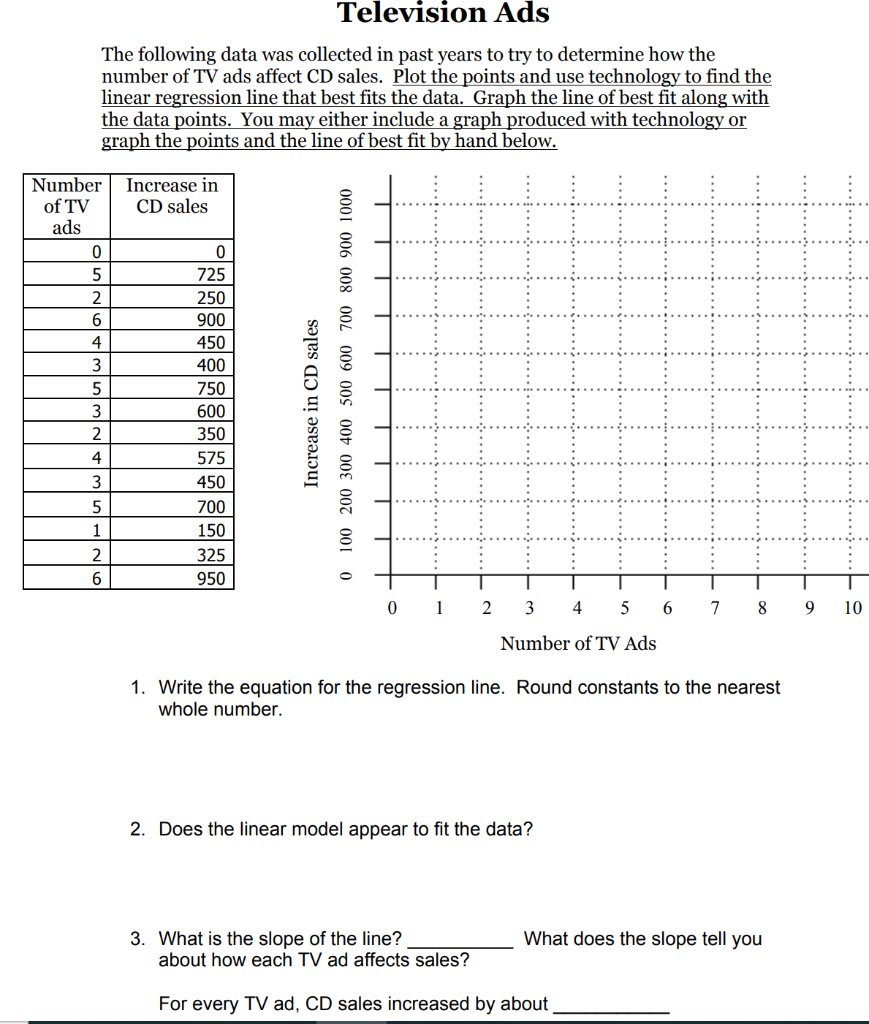
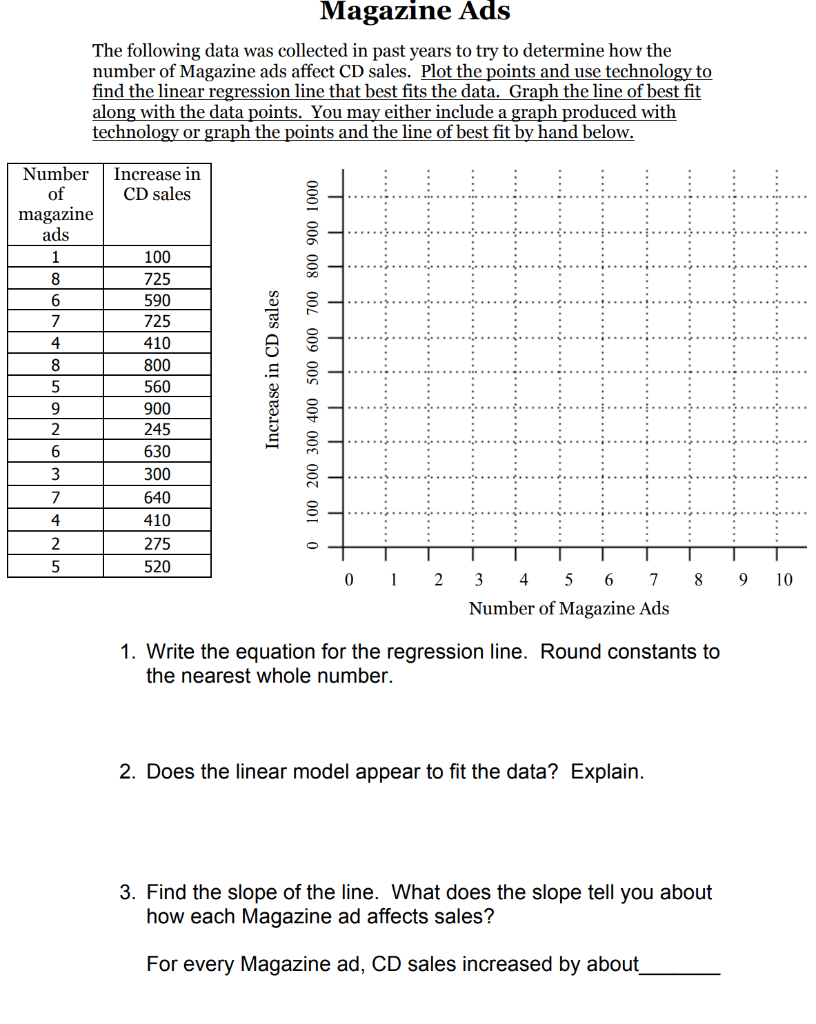
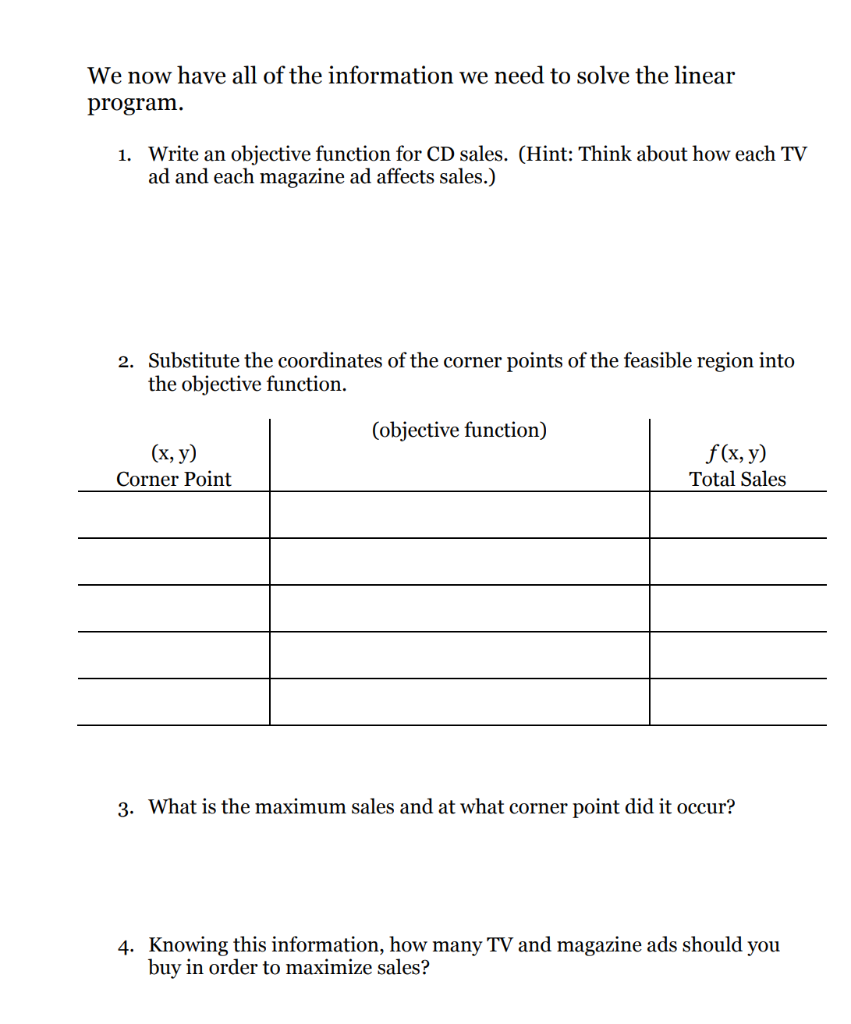
Name(s): Date Due: April 23, 2020 Math 1060 LINEAR PROGRAMMING PROJECT You are the new owner of a music shop in Greenwood. Your first duty as new owner and store manager is to create an advertising plan based on the budget available. You must figure out how many magazine and TV ads to purchase. TV ads cost $600 per airing. Magazine ads cost $1200 per issue. Your total advertising budget is $9,000. 1. If we let x = number of TV ads and y = number of magazine ads, write an inequality for our advertising budget. 2. Due to space limitations, the magazine publishers tell us that we are only allowed to purchase up to 6 magazine ads. The television station informed us that we are only allowed to purchase up to 7 TV ads. Write the two inequalities for these two constraints. 3. Is it possible to buy a negative number of TV ads or a negative number of magazine ads? I don't think so! Write the two inequalities for these two constraints. Graph the system of inequalities you found on the previous page. When you're finished, clearly shade the feasible region. Determine the corner points. These are also called the vertices of the feasible region. Show work below if necessary. Television Ads The following data was collected in past years to try to determine how the number of TV ads affect CD sales. Plot the points and use technology to find the linear regression line that best fits the data. Graph the line of best fit along with the data points. You may either include a graph produced with technology or graph the points and the line of best fit by hand below. Number of TV Increase in CD sales ads 0 725 250 900 450 400 750 600 350 575 450 700 150 325 950 Increase in CD sales 0 100 200 300 400 500 600 700 800 900 1000 3 5. 1 2 0 1 7 8 9 10 2 3 4 5 6 Number of TV Ads 1. Write the equation for the regression line. Round constants to the nearest whole number. 2. Does the linear model appear to fit the data? What does the slope tell you 3. What is the slope of the line? about how each TV ad affects sales? For every TV ad, CD sales increased by about Magazine Ads The following data was collected in past years to try to determine how the number of Magazine ads affect CD sales. Plot the points and use technology to find the linear regression line that best fits the data. Graph the line of best fit along with the data points. You may either include a graph produced with technology or graph the points and the line of best fit by hand below. Number Increase in CD sales of magazine ads 1 8 7 100 725 590 725 410 800 560 900 4 Increase in CD sales 100 200 300 400 500 600 700 800 900 1000 245 3 630 300 640 410 275 0 5 520 ) 1 2 8 9 10 3 4 5 6 7 Number of Magazine Ads 1. Write the equation for the regression line. Round constants to the nearest whole number. 2. Does the linear model appear to fit the data? Explain. 3. Find the slope of the line. What does the slope tell you about how each Magazine ad affects sales? For every Magazine ad, CD sales increased by about We now have all of the information we need to solve the linear program. 1. Write an objective function for CD sales. (Hint: Think about how each TV ad and each magazine ad affects sales.) 2. Substitute the coordinates of the corner points of the feasible region into the objective function. (objective function) (x, y) Corner Point f(x, y) Total Sales 3. What is the maximum sales and at what corner point did it occur? 4. Knowing this information, how many TV and magazine ads should you buy in order to maximize sales? Now that you have found your optimal solution, think about how a change in our allowable advertising values might affect the solution. This is called sensitivity analysis. Your job now is to find out how much a change in one of your constraint values will affect your final profit. For example, what if instead of being allowed to buy 7 television commercials, you were only allowed to buy 5. What would be the new optimal solution? (Show your work below)
Step by Step Solution
There are 3 Steps involved in it

Get step-by-step solutions from verified subject matter experts