

Question: NATIONAL CENTER FOR CASE STUDY TEACHING IN SCIENCE Evolution by Natural Selection in Oldfield Mice by Katherine S. LaCommare, Department of Natural Sciences, University
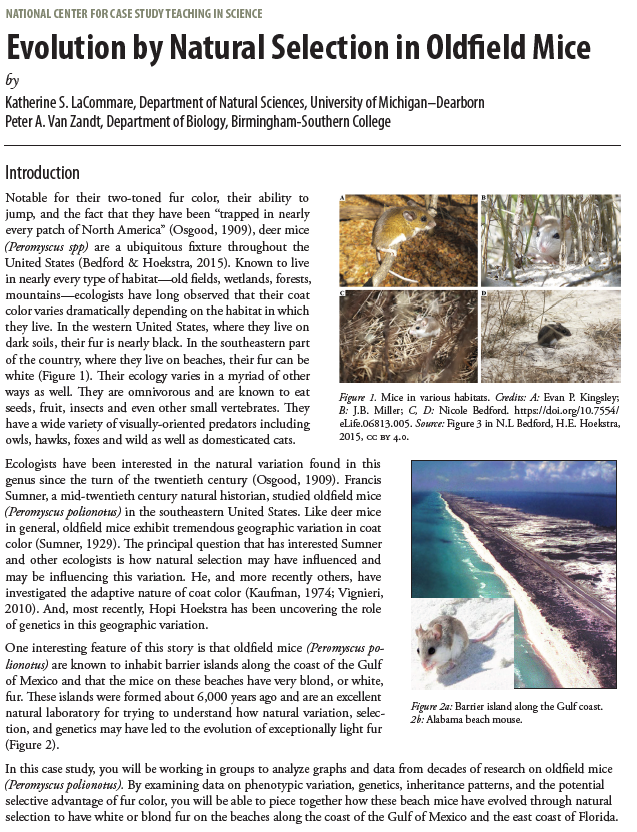
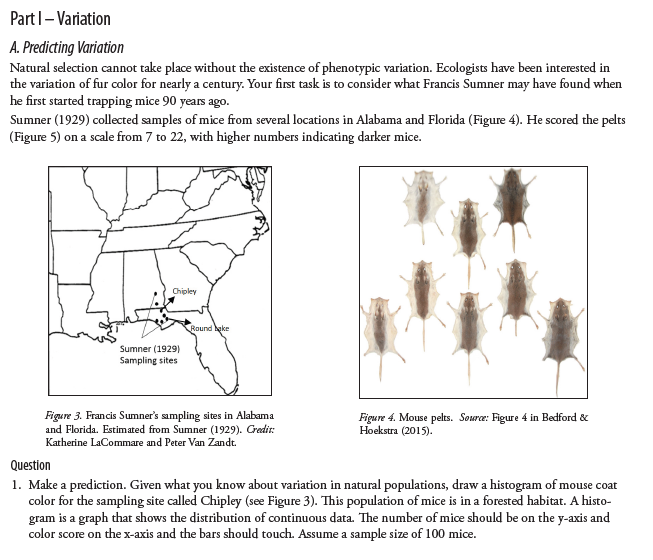
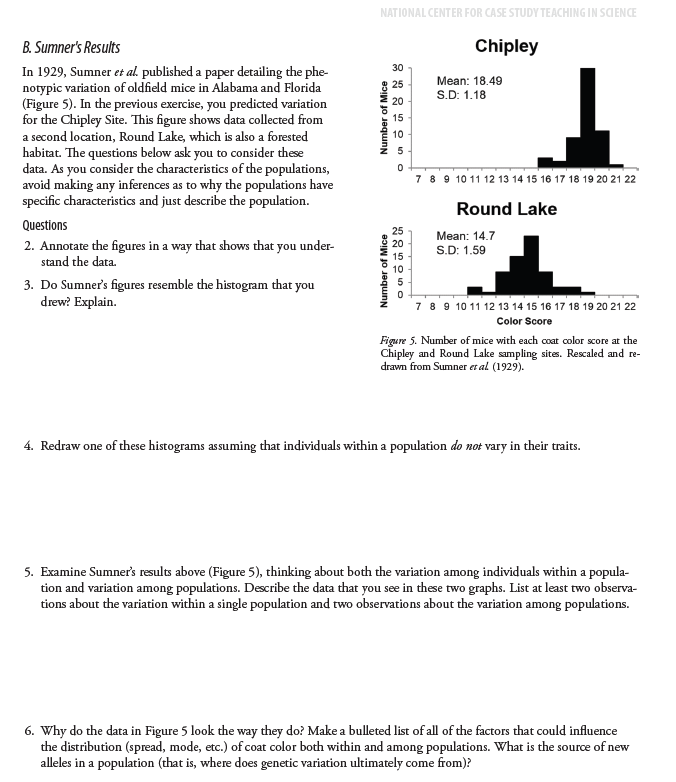
NATIONAL CENTER FOR CASE STUDY TEACHING IN SCIENCE Evolution by Natural Selection in Oldfield Mice by Katherine S. LaCommare, Department of Natural Sciences, University of Michigan-Dearborn Peter A. Van Zandt, Department of Biology, Birmingham-Southern College Introduction Notable for their two-toned fur color, their ability to jump, and the fact that they have been "trapped in nearly every patch of North America" (Osgood, 1909), deer mice (Peromyscus spp) are a ubiquitous fixture throughout the United States (Bedford & Hoekstra, 2015). Known to live in nearly every type of habitat-old fields, wetlands, forests, mountains-ecologists have long observed that their coat color varies dramatically depending on the habitat in which they live. In the western United States, where they live on dark soils, their fur is nearly black. In the southeastern part of the country, where they live on beaches, their fur can be white (Figure 1). Their ecology varies in a myriad of other ways as well. They are omnivorous and are known to eat seeds, fruit, insects and even other small vertebrates. They have a wide variety of visually-oriented predators including owls, hawks, foxes and wild as well as domesticated cats. Figure 1. Mice in various habitats. Credits: A: Evan P. Kingsley, B: J.B. Miller; C, D: Nicole Bedford. https://doi.org/10.7554/ eLife.06813.005. Source: Figure 3 in N.L Bedford, H.E. Hoekstra, 2015, CC BY 4.0. Ecologists have been interested in the natural variation found in this genus since the turn of the twentieth century (Osgood, 1909). Francis Sumner, a mid-twentieth century natural historian, studied oldfield mice (Peromyscus polionotus) in the southeastern United States. Like deer mice in general, oldfield mice exhibit tremendous geographic variation in coat color (Sumner, 1929). The principal question that has interested Sumner and other ecologists is how natural selection may have influenced and may be influencing this variation. He, and more recently others, have investigated the adaptive nature of coat color (Kaufman, 1974; Vignieri, 2010). And, most recently, Hopi Hoekstra has been uncovering the role of genetics in this geographic variation. One interesting feature of this story is that oldfield mice (Peromyscus po- lionotus) are known to inhabit barrier islands along the coast of the Gulf of Mexico and that the mice on these beaches have very blond, or white, fur. These islands were formed about 6,000 years ago and are an excellent natural laboratory for trying to understand how natural variation, selec- tion, and genetics may have led to the evolution of exceptionally light fur (Figure 2). Figure 2a: Barrier island along the Gulf coast. 2b: Alabama beach mouse. In this case study, you will be working in groups to analyze graphs and data from decades of research on oldfield mice (Peromyscus polionotus). By examining data on phenotypic variation, genetics, inheritance patterns, and the potential selective advantage of fur color, you will be able to piece together how these beach mice have evolved through natural selection to have white or blond fur on the beaches along the coast of the Gulf of Mexico and the east coast of Florida. Part I - Variation A. Predicting Variation Natural selection cannot take place without the existence of phenotypic variation. Ecologists have been interested in the variation of fur color for nearly a century. Your first task is to consider what Francis Sumner may have found when he first started trapping mice 90 years ago. Sumner (1929) collected samples of mice from several locations in Alabama and Florida (Figure 4). He scored the pelts (Figure 5) on a scale from 7 to 22, with higher numbers indicating darker mice. Chipley Sumner (1929) Sampling sites Round Lake Figure 3. Francis Sumner's sampling sites in Alabama and Florida. Estimated from Sumner (1929). Credit: Katherine LaCommare and Peter Van Zandt. Question Figure 4. Mouse pelts. Source: Figure 4 in Bedford & Hoekstra (2015). 1. Make a prediction. Given what you know about variation in natural populations, draw a histogram of mouse coat color for the sampling site called Chipley (see Figure 3). This population of mice is in a forested habitat. A histo- gram is a graph that shows the distribution of continuous data. The number of mice should be on the y-axis and color score on the x-axis and the bars should touch. Assume a sample size of 100 mice. B. Sumner's Results In 1929, Sumner et al. published a paper detailing the phe- notypic variation of oldfield mice in Alabama and Florida (Figure 5). In the previous exercise, you predicted variation for the Chipley Site. This figure shows data collected from a second location, Round Lake, which is also a forested habitat. The questions below ask you to consider these data. As you consider the characteristics of the populations, avoid making any inferences as to why the populations have specific characteristics and just describe the population. Questions 2. Annotate the figures in a way that shows that you under- stand the data. 3. Do Sumner's figures resemble the histogram that you drew? Explain. Number of Mice NATIONAL CENTER FOR CASE STUDY TEACHING IN SCIENCE 30 2225050 15 Chipley Mean: 18.49 S.D: 1.18 Number of Mice 10 225050 7 8 9 10 11 12 13 14 15 16 17 18 19 20 21 22 Round Lake Mean: 14.7 S.D: 1.59 7 8 9 10 11 12 13 14 15 16 17 18 19 20 21 22 Color Score Figure 5. Number of mice with each coat color score at the Chipley and Round Lake sampling sites. Rescaled and re- drawn from Sumner et al (1929). 4. Redraw one of these histograms assuming that individuals within a population do not vary in their traits. 5. Examine Sumner's results above (Figure 5), thinking about both the variation among individuals within a popula- tion and variation among populations. Describe the data that you see in these two graphs. List at least two observa- tions about the variation within a single population and two observations about the variation among populations. 6. Why do the data in Figure 5 look the way they do? Make a bulleted list of all of the factors that could influence the distribution (spread, mode, etc.) of coat color both within and among populations. What is the source of new alleles in a population (that is, where does genetic variation ultimately come from)?
Step by Step Solution
There are 3 Steps involved in it

Get step-by-step solutions from verified subject matter experts