

Question: nbformat:4,nbformat minor :0, metadata : colabname Assignment 6- student. pynb, version :-o. 3. 2 , provenance : [ ] , collapsed-sections :
![version" :-o. 3. 2 " , "provenance" : [ ] , "collapsed-sections](https://dsd5zvtm8ll6.cloudfront.net/si.experts.images/questions/2024/09/66f1e73d1fbbd_40466f1e73c932b6.jpg)
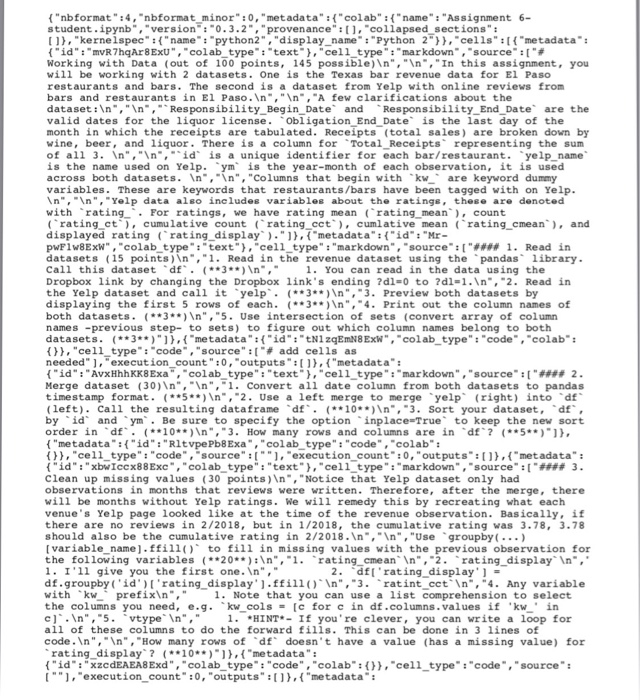
"nbformat":4,"nbformat minor" :0, "metadata" : "colab""name" "Assignment 6- student. pynb", " version" :-o. 3. 2 " , "provenance" : [ ] , "collapsed-sections " : [,"kernelspec":"name": "python2","display name": "Python 2",cells" "metadata": { "id": "MR7hqAr8 ExU" , "colab-type" "text-), "cel 1-type" : "markdown",-source" : [ "# Working with Data (out of 100 points, 145 possible)In", "In, "In this assignment, you will be working with 2 datasets. One is the Texas bar revenue data for El Paso restaurants and bars. The second is a dataset from Yelp with online reviews from bars and restaurants in El Paso. ,"n, "A few clarifications about the datasetn,In,Responsibility Begin Date andResponsibility End Date are the valid dates for the liquor license. obligation End Date is the last day of the month in which the receipts are tabulated. Receipts (total sales) are broken down by of all 3. In",nid is a unique identifier for each bar/restaurant. yelp name across both datasets. In,n","Columns that begin with kware keyword dummy variables. These are keywords that restaurants/bars have been tagged with on Yelp "," ","Yelp data algo includ@e variab leg about the ratin with rating For ratings, we have rating mean (rating mean, count displayed ratingrating display,(metadata"id :"Mr- pwFlw8ExW","colab type":"text", "cel1_type":"markdown", "source:[1 Read in datasets (15 points) ,"1. Read in the revenue dataset using the pandas library. Dropbox link by changing the Dropbox link's ending ?dl=0 to ?dl=1. ","2. Read in the Yelp dataset and call it yelp 3)In",3. Preview both datasets by displaying the first 5 rows of each. 3n", 4. Print out the column names of both datasets. 3)n","5. Use intersection of sets (convert array of column names -previous step- to sets) to figure out which column names belong to both datasets. (3*, "metadata""id":tN1zqEmN8Ex,"colabtype":"code""colab: ()), "cell-type": "code", "source":["# add cells as needed" ], "execution_count":0, "outputs,"metadata": {"id":"AvxHhhKK8Exa", "colab-type": "text"), "cell-type":"markdown", "source"q" #2 Merge dataset (30)In,. Convert all date column from both datasets to pandas (left). Call the ("metadata:("id": "RitvpePb8Exa,"colab_type" "code", "colab f,ce11_type":code, source": "execution count":0, "outputs":etadata" {"id":"Xbwiccx88Exc", "colab-type":"text"), "cell-type": "markdown ","source":["### 3 Clean up missing values (30 points)In,"Notice that Yelp dataset only had observations in months that reviews were written. Therefore, after the merge, there will be months without Yelp ratings. We will remedy this by recreating what each venue's Yelp page looked like at the time of the revenue observation. Basically, if in 2/2018, but in 1/2018 should also be the cumulative rating in 2/2018.In,In", "Use groupby(.. e).ffill to fill in in I'11 give you the first one.In"," 2. .dft' rating-display'] = with kw prefixin," 1. Note that you can use a list comprehension to select 1HINT-If you're clever, you can write a loop for value all of these columns to do the forward fills. This can be done in 3 lines of doesn rating display? 10*,"metadata": ("id"xzcdEAEA8Exd", "colab_type": "code", "colab: [".execution count :0, "outputs1),f"metadata" "cell type:"code","source": ("id":"-nkzZNjH8Exf", "colab-type": "text"),"cell-type":"markdown ","source":["#### 4. Do some data mining (60 points) "," ","1. Which 5 venues had the most total alcohol sales in their entire histories? How much did each venue sel15*n", 1. Which 5 venues had the most wine sales? 1iquor sales? beer sales?3*n", 1. Using th vtype variable to select only venues designated as Bar,which 5 bars sold the most wine? 2**n","2. Which 5 venues has the most number of total Yelp reviews in this dataset? 5In", "3. Create a cumulative total receipts column, Total C Receipts. Use groupby combined with cums um function, e.g 2 df [ . Total-CReceipts' ] df. groupby ( something) [ something] . cumsum ( )-. ( ** 5** ) " , "3. Create a temporary dataset called temp that selects the last row of each venue. Hint make sure your dataset is sorted by id and ym, then use groupbylast functions to create tempNote this selects the latest observation for each venue 1. Using temp,which 5 venues with at least 30 reviews have the 10**)In"," highest cumulative Yelp rating? Show a table with 5 rows and the columns Location Name and rating cmean5In","2. Same as above, but find 5 lowest rated. 3**)n","3. What are the top 5 Yelp-rated \ tex-mex restaurants with at least 30 reviews?2**)In",4. Create a scatter plot of rating cmean (x-axis) vs. Total CReceipts (y-axis) for restaurantsvtype is Restaurant) with at least 30 reviews.10)In", 4. In one figure, plot the total beer, liquor, and wine revenues by month (x-axis s ym10 ("metadata":("id":"yftcRBQm8Exg", "colab type":"code", "colab { } } , "cell-type" : "code", "source" [ "-], "execution-count": 0, "outputs": )) } "nbformat":4,"nbformat minor" :0, "metadata" : "colab""name" "Assignment 6- student. pynb", " version" :-o. 3. 2 " , "provenance" : [ ] , "collapsed-sections " : [,"kernelspec":"name": "python2","display name": "Python 2",cells" "metadata": { "id": "MR7hqAr8 ExU" , "colab-type" "text-), "cel 1-type" : "markdown",-source" : [ "# Working with Data (out of 100 points, 145 possible)In", "In, "In this assignment, you will be working with 2 datasets. One is the Texas bar revenue data for El Paso restaurants and bars. The second is a dataset from Yelp with online reviews from bars and restaurants in El Paso. ,"n, "A few clarifications about the datasetn,In,Responsibility Begin Date andResponsibility End Date are the valid dates for the liquor license. obligation End Date is the last day of the month in which the receipts are tabulated. Receipts (total sales) are broken down by of all 3. In",nid is a unique identifier for each bar/restaurant. yelp name across both datasets. In,n","Columns that begin with kware keyword dummy variables. These are keywords that restaurants/bars have been tagged with on Yelp "," ","Yelp data algo includ@e variab leg about the ratin with rating For ratings, we have rating mean (rating mean, count displayed ratingrating display,(metadata"id :"Mr- pwFlw8ExW","colab type":"text", "cel1_type":"markdown", "source:[1 Read in datasets (15 points) ,"1. Read in the revenue dataset using the pandas library. Dropbox link by changing the Dropbox link's ending ?dl=0 to ?dl=1. ","2. Read in the Yelp dataset and call it yelp 3)In",3. Preview both datasets by displaying the first 5 rows of each. 3n", 4. Print out the column names of both datasets. 3)n","5. Use intersection of sets (convert array of column names -previous step- to sets) to figure out which column names belong to both datasets. (3*, "metadata""id":tN1zqEmN8Ex,"colabtype":"code""colab: ()), "cell-type": "code", "source":["# add cells as needed" ], "execution_count":0, "outputs,"metadata": {"id":"AvxHhhKK8Exa", "colab-type": "text"), "cell-type":"markdown", "source"q" #2 Merge dataset (30)In,. Convert all date column from both datasets to pandas (left). Call the ("metadata:("id": "RitvpePb8Exa,"colab_type" "code", "colab f,ce11_type":code, source": "execution count":0, "outputs":etadata" {"id":"Xbwiccx88Exc", "colab-type":"text"), "cell-type": "markdown ","source":["### 3 Clean up missing values (30 points)In,"Notice that Yelp dataset only had observations in months that reviews were written. Therefore, after the merge, there will be months without Yelp ratings. We will remedy this by recreating what each venue's Yelp page looked like at the time of the revenue observation. Basically, if in 2/2018, but in 1/2018 should also be the cumulative rating in 2/2018.In,In", "Use groupby(.. e).ffill to fill in in I'11 give you the first one.In"," 2. .dft' rating-display'] = with kw prefixin," 1. Note that you can use a list comprehension to select 1HINT-If you're clever, you can write a loop for value all of these columns to do the forward fills. This can be done in 3 lines of doesn rating display? 10*,"metadata": ("id"xzcdEAEA8Exd", "colab_type": "code", "colab: [".execution count :0, "outputs1),f"metadata" "cell type:"code","source": ("id":"-nkzZNjH8Exf", "colab-type": "text"),"cell-type":"markdown ","source":["#### 4. Do some data mining (60 points) "," ","1. Which 5 venues had the most total alcohol sales in their entire histories? How much did each venue sel15*n", 1. Which 5 venues had the most wine sales? 1iquor sales? beer sales?3*n", 1. Using th vtype variable to select only venues designated as Bar,which 5 bars sold the most wine? 2**n","2. Which 5 venues has the most number of total Yelp reviews in this dataset? 5In", "3. Create a cumulative total receipts column, Total C Receipts. Use groupby combined with cums um function, e.g 2 df [ . Total-CReceipts' ] df. groupby ( something) [ something] . cumsum ( )-. ( ** 5** ) " , "3. Create a temporary dataset called temp that selects the last row of each venue. Hint make sure your dataset is sorted by id and ym, then use groupbylast functions to create tempNote this selects the latest observation for each venue 1. Using temp,which 5 venues with at least 30 reviews have the 10**)In"," highest cumulative Yelp rating? Show a table with 5 rows and the columns Location Name and rating cmean5In","2. Same as above, but find 5 lowest rated. 3**)n","3. What are the top 5 Yelp-rated \ tex-mex restaurants with at least 30 reviews?2**)In",4. Create a scatter plot of rating cmean (x-axis) vs. Total CReceipts (y-axis) for restaurantsvtype is Restaurant) with at least 30 reviews.10)In", 4. In one figure, plot the total beer, liquor, and wine revenues by month (x-axis s ym10 ("metadata":("id":"yftcRBQm8Exg", "colab type":"code", "colab { } } , "cell-type" : "code", "source" [ "-], "execution-count": 0, "outputs": )) }
Step by Step Solution
There are 3 Steps involved in it

Get step-by-step solutions from verified subject matter experts