

Question: need #2 in a pie chart not histogram. thanks Chapter 15 . Quality Tools (Part 2) Table 15.1 Traffic Fine Revenues for Three Months March
need #2 in a pie chart not histogram. thanks
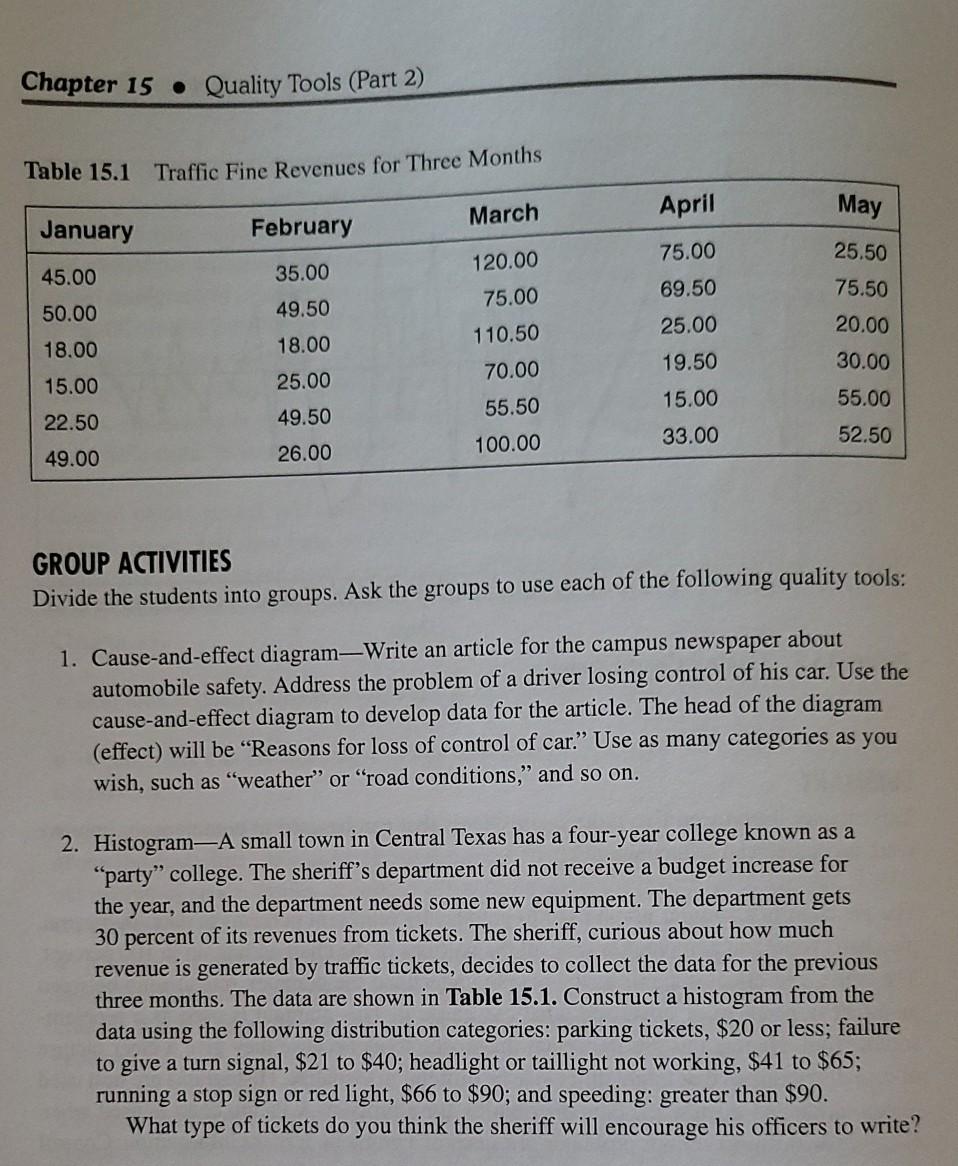
Chapter 15 . Quality Tools (Part 2) Table 15.1 Traffic Fine Revenues for Three Months March April May January February 75.00 25.50 45.00 35.00 120.00 75.00 69.50 75.50 50.00 49.50 25.00 20.00 18.00 18.00 25.00 110.50 70.00 19.50 30.00 15.00 55.50 15.00 55.00 22.50 49.50 33.00 52.50 100.00 49.00 26.00 GROUP ACTIVITIES Divide the students into groups. Ask the groups to use each of the following quality tools: 1. Cause-and-effect diagram-Write an article for the campus newspaper about automobile safety. Address the problem of a driver losing control of his car. Use the cause-and-effect diagram to develop data for the article. The head of the diagram (effect) will be "Reasons for loss of control of car." Use as many categories as you wish, such as "weather" or "road conditions, and so on. the 2. Histogram-A small town in Central Texas has a four-year college known as a "party" college. The sheriff's department did not receive a budget increase for year, and the department needs some new equipment. The department gets 30 percent of its revenues from tickets. The sheriff, curious about how much revenue is generated by traffic tickets, decides to collect the data for the previous three months. The data are shown in Table 15.1. Construct a histogram from the data using the following distribution categories: parking tickets, $20 or less; failure to give a turn signal, $21 to $40; headlight or taillight not working, $41 to $65; running a stop sign or red light, $66 to $90; and speeding: greater than $90. What type of tickets do you think the sheriff will encourage his officers to writeStep by Step Solution
There are 3 Steps involved in it
1 Expert Approved Answer
Step: 1 Unlock

Question Has Been Solved by an Expert!
Get step-by-step solutions from verified subject matter experts
Step: 2 Unlock
Step: 3 Unlock