

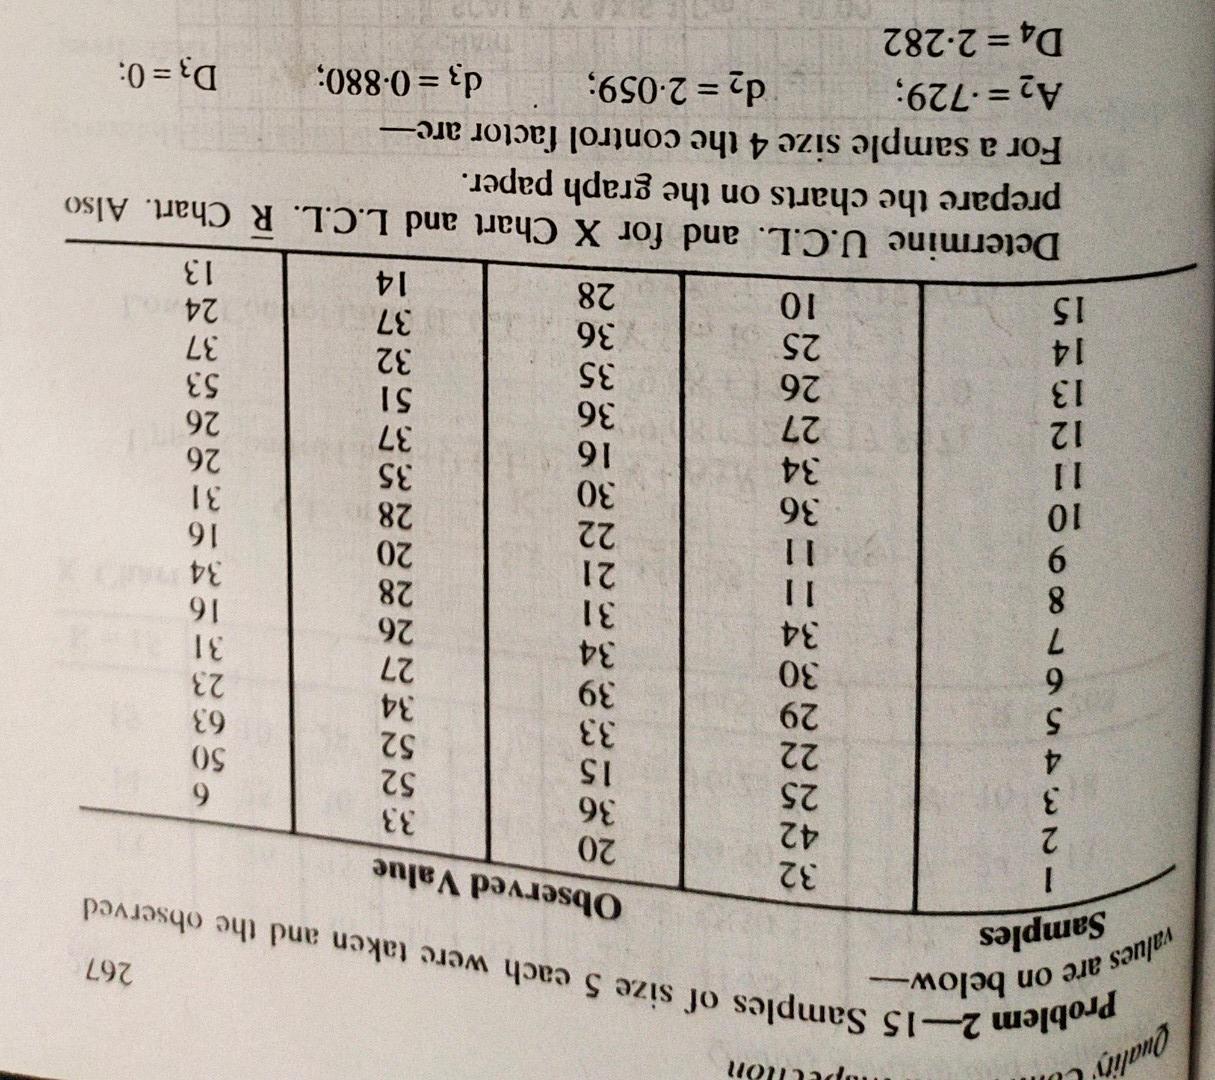
Question: need a correct answer Qualin' values are on below- 267 Samples Problem 2-15 Samples of size 5 each were taken and the observed Observed Value
need a correct answer
Qualin' values are on below- 267 Samples Problem 2-15 Samples of size 5 each were taken and the observed Observed Value 32 42 25 20 36 15 33 52 52 33 34 11 35 1 2 3 4 22 50 63 5 29 39 23 6 30 27 34 31 7 34 26 31 16 8 11 28 21 34 9 11 20 22 16 10 36 28 30 31 34 16 26 37 12 27 26 36 13 26 53 35 32 14 25 37 36 37 24 15 10 28 14 13 Determine U.C.L. and for X Chart and L.C.L. R Chart. Also prepare the charts on the graph paper. For a sample size 4 the control factor are- A2=.729; d2 = 2.059; dz = 0880; D3 = 0; D4 = 2.282 51Step by Step Solution
There are 3 Steps involved in it
1 Expert Approved Answer
Step: 1 Unlock

Question Has Been Solved by an Expert!
Get step-by-step solutions from verified subject matter experts
Step: 2 Unlock
Step: 3 Unlock