

Question: need a script file for this! 2. Plotting Conic Sections - Revisited This problem is a repeat of Application 1 Problem 3 with some additional
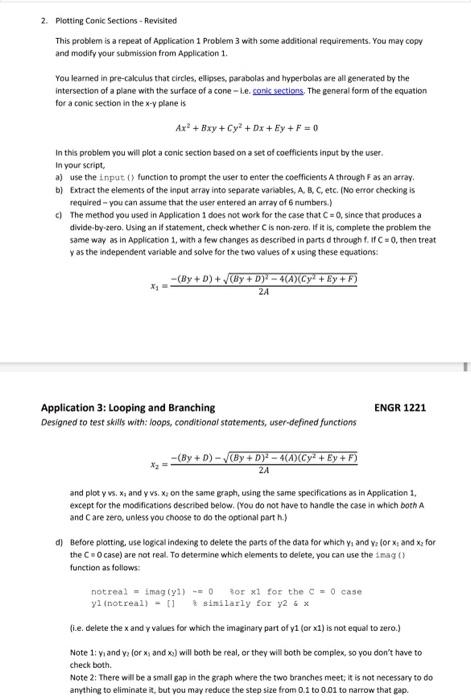
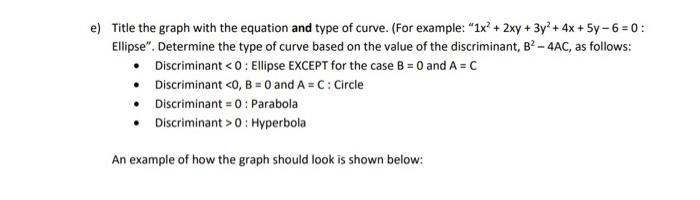
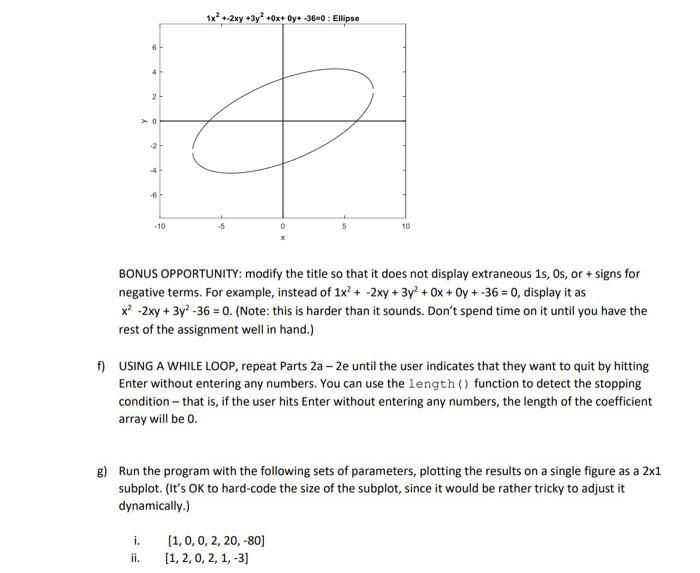
2. Plotting Conic Sections - Revisited This problem is a repeat of Application 1 Problem 3 with some additional requirements, You may copy and modify your submission from Application 1. You learned in pre-cakculus that circles, ellinses, parabolas and hyperbolas are all generated by the intersection of a plane with the surface of a cone - Le. The general form of the equation for a conic section in the xy plane is Ax2+Bxy+Cy2+Dx+Ey+F=0 In this problem you will plot a conic section based on a set of coefficients input by the user. in your seript, a) use the input ( ) function to prompt the user to enter the coefficients A through F as an array. b) Extract the elements of the input afray into separate variables, A, B, C, etc. (No error checking is required - you can assume that the user entered an array of 6 numbers.) c) The method you used in Application 1 does not wook for the case that C=0, since that produces a divide-by-zero, Using an if statement, check whether C is non-zero, If it is, complete the problem the same way as in Application 1, with a few changes as described in parts d through f, if C=0, then treat y as the independent variable and solve for the two values of x using these equations: x1=2A(By+D)+(By+D)24(A)(Cy2+Dy+F) Application 3: Looping and Branching ENGR 1221 Designed to test skilis with: loops, conditionol statements, user-defined functions x2=2A(By+D)(By+D)24(A)(Cy2+Ey+F) and plot y vs. x3 and yv vi. x2 on the same graph, using the same specifications as in Application 1 , except for the modifications described below. (You do not have to handle the case in which both A and C are zero, unless you choose to do the optional part h.) d) Before plotting. use logical indexing to delete the parts of the data for which y1 and y2 for x4 and x2 for the C=0 case) are not real. To determine which elements to delete, you can use the 1nag(C function as follows: notreal=imag(y1)=0korx1forthec=0casey1(notreal)[1tsinilarlyfory2:x (i.e. delete the x and y values for which the imaginary part of y1 (or x1 ) is not equal to zero.) Note 1: y1 and y2 (or x1 and x2 ) will both be real, or they will both be complex, so you don't have to check both. Note 2: There will be a small gap in the graph where the two branches meet; it is not necessary to do anything to eliminate in, but you may reduce the step size from 0.1 to 0.01 to narrow that gap. e) Title the graph with the equation and type of curve. (For example: " 1x2+2xy+3y2+4x+5y6=0 : Ellipse". Determine the type of curve based on the value of the discriminant, B24AC, as follows: - Discriminant 0: Hyperbola An example of how the graph should look is shown below: BONUS OPPORTUNITY: modify the title so that it does not display extraneous 1s, 0s, or + signs for negative terms. For example, instead of 1x2+2xy+3y2+0x+0y+36=0, display it as x22xy+3y236=0. (Note: this is harder than it sounds. Don't spend time on it until you have the rest of the assignment well in hand.) USING A WHILE LOOP, repeat Parts 2a2e until the user indicates that they want to quit by hitting Enter without entering any numbers. You can use the length () function to detect the stopping condition - that is, if the user hits Enter without entering any numbers, the length of the coefficient array will be 0. g) Run the program with the following sets of parameters, plotting the results on a single figure as a 21 subplot. (It's OK to hard-code the size of the subplot, since it would be rather tricky to adjust it dynamically.) i. [1,0,0,2,20,80] ii. [1,2,0,2,1,3]
Step by Step Solution
There are 3 Steps involved in it

Get step-by-step solutions from verified subject matter experts