

Question: Need a walkthrough on this question The following graph is the number of deaths caused by the Corona virus with time being the number of
Need a walkthrough on this question
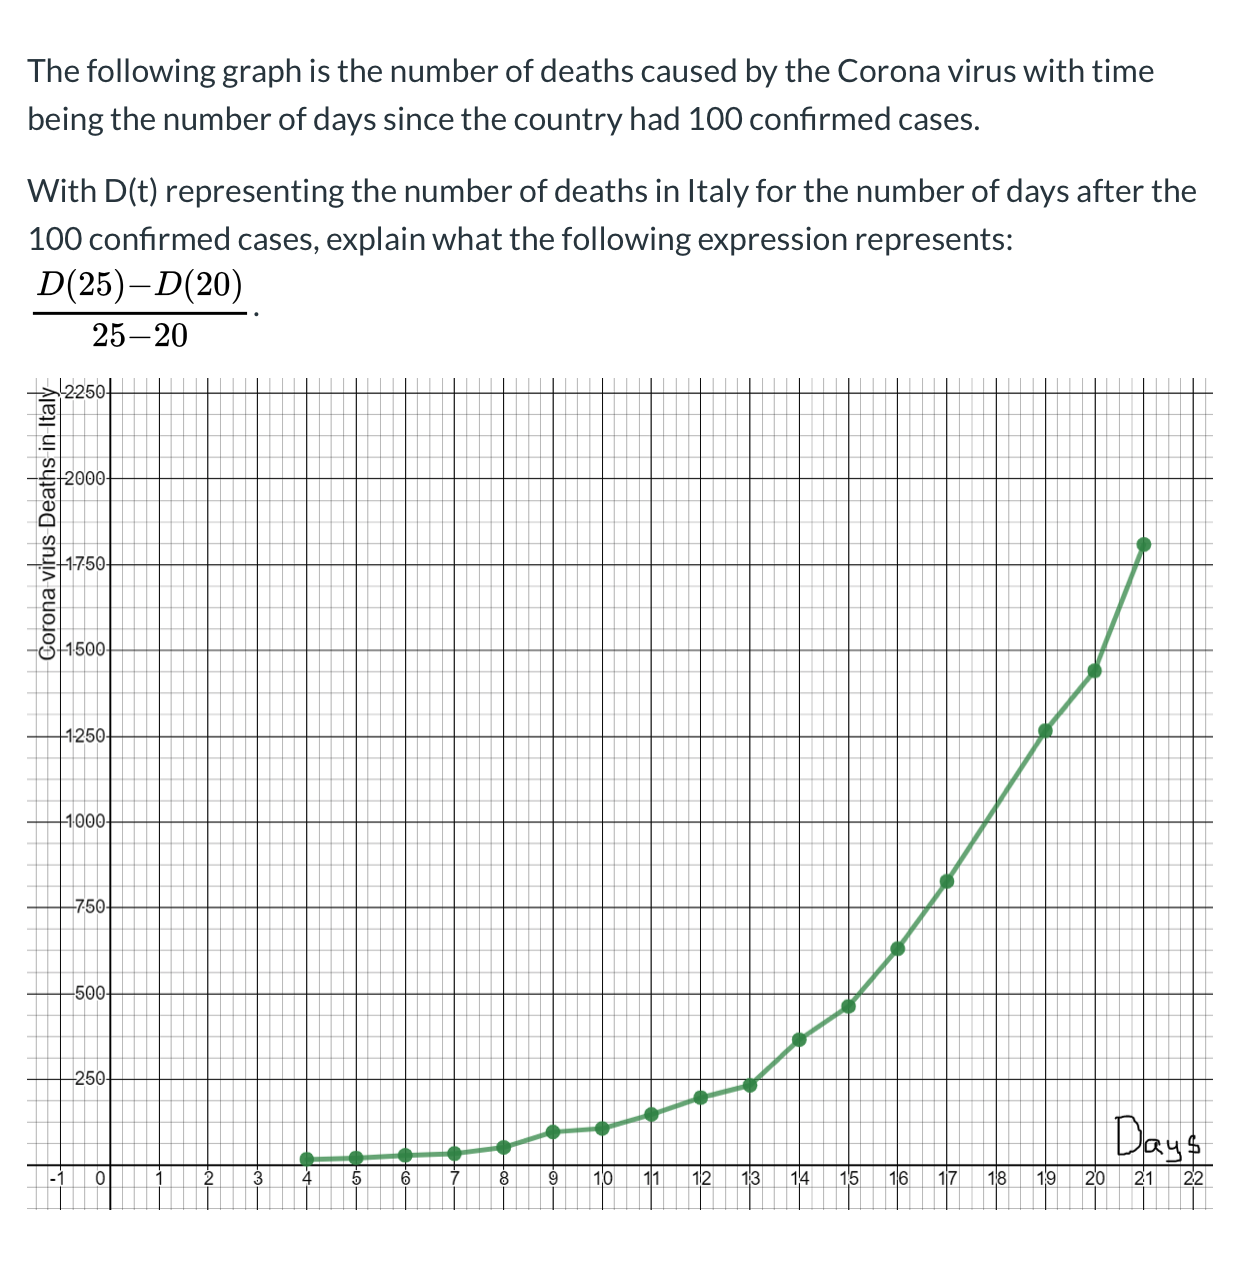
The following graph is the number of deaths caused by the Corona virus with time being the number of days since the country had 100 confirmed cases. With D(t) representing the number of deaths in Italy for the number of days after the 100 confirmed cases, explain what the following expression represents: D(25) -D(20) 25-20 2250 Corona virus Deaths in Italy 2000 -1-7-50 1500 -1-250 1000- -7:50- -500- 250 8 9 Days
Step by Step Solution
There are 3 Steps involved in it
1 Expert Approved Answer
Step: 1 Unlock

Question Has Been Solved by an Expert!
Get step-by-step solutions from verified subject matter experts
Step: 2 Unlock
Step: 3 Unlock