

Question: need answer as soon as possible For the data shown below in Table 1 determine the following: 1. Check the dataset for any outliers, if
need answer as soon as possible
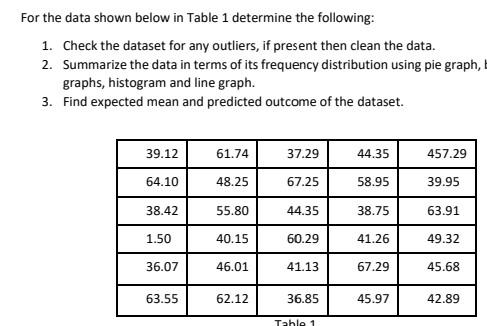
For the data shown below in Table 1 determine the following: 1. Check the dataset for any outliers, if present then clean the data. 2. Summarize the data in terms of its frequency distribution using pie graph, graphs, histogram and line graph. 3. Find expected mean and predicted outcome of the dataset
Step by Step Solution
There are 3 Steps involved in it
1 Expert Approved Answer
Step: 1 Unlock

Question Has Been Solved by an Expert!
Get step-by-step solutions from verified subject matter experts
Step: 2 Unlock
Step: 3 Unlock