

Question: need answer for C. Homework: MSL 8 Question 7, 13.2.4 Part 3 of 4 JUULUU JUU 12 points Points: 0.5 of 1 nev Save you
need answer for C. 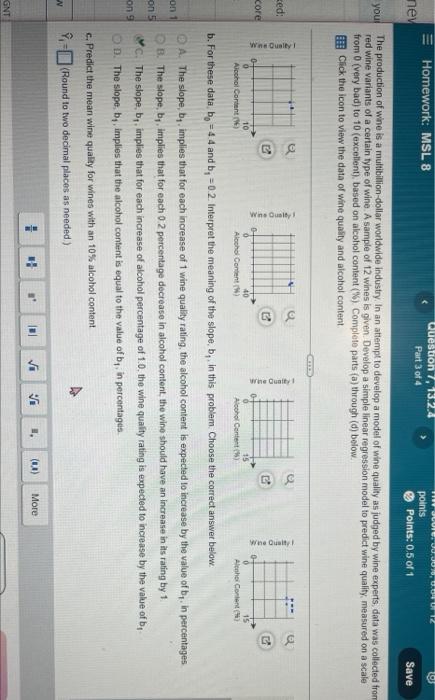
Homework: MSL 8 Question 7, 13.2.4 Part 3 of 4 JUULUU JUU 12 points Points: 0.5 of 1 nev Save you The production of wine is a multibillion-dollar worldwide industryIn an attempt to develop a model of wine quality as judged by wine experts, data was collected from red wine variants of a certain type of wine A sample of 12 wines is given Develop a simple linear regression model to predict wine quality measured on a scale from 0 (very bad) to 10 (excellent), based on alcohol content ("%) Complete parts (a) through (d) below. Click the icon to view the data of wine quality and alcohol content CCRD Q ced: Wine Qualty Wine Quity Wine Quatty Wine Quity core 10 0 15 Alcohol Content 00 Alcohol Content) Alcohol Content Alenhor Content on 1 on 5 b. For these data, bo = 4 4 and b, = 0.2. Interpret the meaning of the slope, be in this problem. Choose the correct answer below. A. The slope, by implies that for each increase of 1 wine quality rating, the alcohol content is expected to increase by the value of b, in percentages B. The slope, by, implies that for each 02 percentage decrease in alcohol content, the wine should have an increase in its rating by 1 C. The slope, bp, implies that for each increase of alcohol percentage of 1.0, the wine quality rating is expected to increase by the value of b, OD. The slope, by, implies that the alcohol content is equal to the value of b, in percentages c. Predict the mean wine quality for wines with an 10% alcohol content Y-(Round to two decimal places as needed) on 9 N #! al vi vo S (0) More GNT
Step by Step Solution
There are 3 Steps involved in it
1 Expert Approved Answer
Step: 1 Unlock

Question Has Been Solved by an Expert!
Get step-by-step solutions from verified subject matter experts
Step: 2 Unlock
Step: 3 Unlock