

Question: need answer You need to create an excel file as per described in the following questions and upload it to your Schoology account. Steps: Create
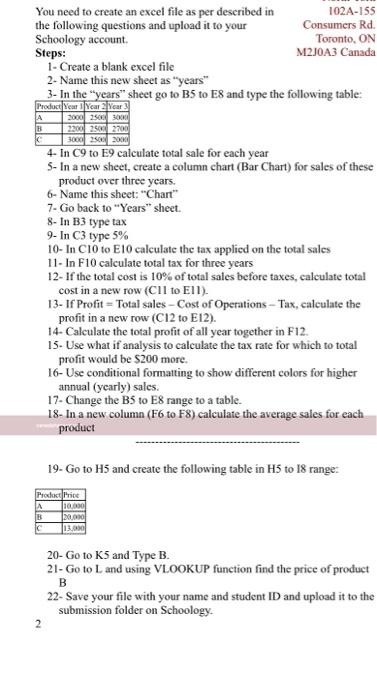
You need to create an excel file as per described in the following questions and upload it to your Schoology account.
Steps:
Create a blank excel file
Name this new sheet as years
In the years sheet go to B5 to E8 and type the following table:
Product | Year 1 | Year 2 | Year 3 |
A | 2000 | 2500 | 3000 |
B | 2200 | 2500 | 2700 |
C | 3000 | 2500 | 2000 |
In C9 to E9 calculate total sale for each year
In a new sheet, create a column chart (Bar Chart) for sales of these product over three years.
Name this sheet: Chart
Go back to Years sheet.
In B3 type tax
In C3 type 5%
In C10 to E10 calculate the tax applied on the total sales
In F10 calculate total tax for three years
If the total cost is 10% of total sales before taxes, calculate total cost in a new row (C11 to E11).
1
North York
102A-155 Consumers Rd. Toronto, ON
M2J0A3 Canada
If Profit = Total sales Cost of Operations Tax, calculate the profit in a new row (C12 to E12).
Calculate the total profit of all year together in F12.
Use what if analysis to calculate the tax rate for which to total profit would be $200 more.
Use conditional formatting to show different colors for higher annual (yearly) sales.
Change the B5 to E8 range to a table.
In a new column (F6 to F8) calculate the average sales for each product
------------------------------------------
Go to H5 and create the following table in H5 to I8 range:
Product | Price |
A | 10,000 |
B | 20,000 |
C | 13,000 |
Go to K5 and Type B.
Go to L and using VLOOKUP function find the price of product B
Save your file with your name and student ID and upload it to the submission folder on Schoology.
A B You need to create an excel file as per described in 102A-155 the following questions and upload it to your Consumers Rd. Schoology account Toronto, ON Steps: M2J0A3 Canada 1- Create a blank excel file 2- Name this new sheet as "years" 3- In the "years" sheet go to B5 to E8 and type the following table: Product Year 1 Year 2 Year 2000 2500 3000 2200 2500 2700 C 3000 2500 2000 4- In C9 to E9 calculate total sale for each year 5- In a new sheet, create a column chart (Bar Chart) for sales of these product over three years. 6- Name this sheet: "Chart" 7-Go back to "Years" sheet. 8- In B3 type tax 9- In C3 type 5% 10- In C10 to E10 calculate the tax applied on the total sales 11- In F10 calculate total tax for three years 12- If the total cost is 10% of total sales before taxes, calculate total cost in a new row (Cll to Ell). 13- If Profit=Total sales - Cost of Operations - Tax, calculate the profit in a new row (C12 to E12). 14- Calculate the total profit of all year together in F12. 15. Use what if analysis to calculate the tax rate for which to total profit would be $200 more. 16- Use conditional formatting to show different colors for higher annual (yearly) sales. 17- Change the B5 to E8 range to a table. 18- In a new column (F6 to F8) calculate the average sales for each product 19- Go to H5 and create the following table in H5 to 18 range: Product Price A 10000 B 20,000 c 13.000 20- Go to K5 and Type B. 21- Go to L and using VLOOKUP function find the price of product B 22- Save your file with your name and student ID and upload it to the submission folder on Schoology 2
Step by Step Solution
There are 3 Steps involved in it

Get step-by-step solutions from verified subject matter experts