

Question: NEED ASAP. Please draft a balance sheet for the below statement. Thank you The assignment is for a Business Plan: Financial Plan 1. create 12
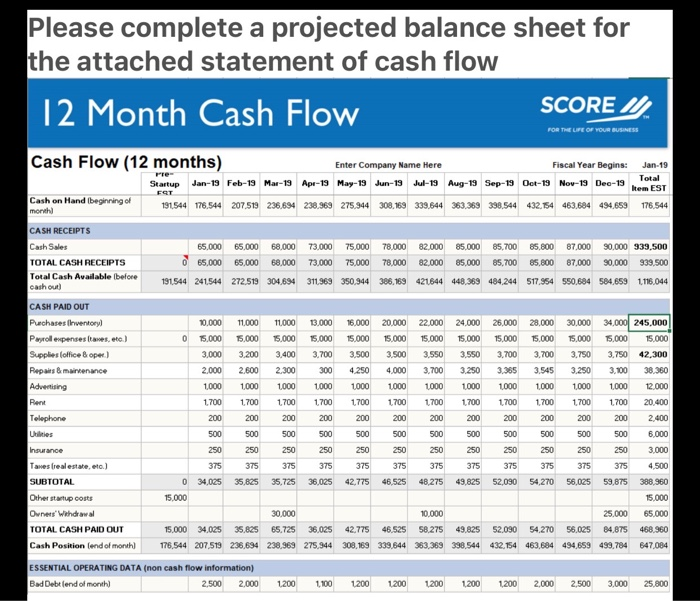
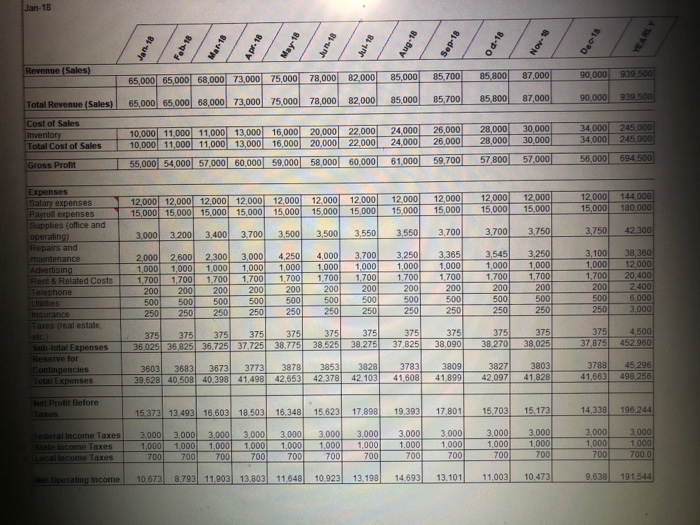
Please complete a projected balance sheet for the attached statement of cash flow 12 Month Cash Flow SCORE V FOR THE USE OF YOUR BUSINESS EST 10.000 Cash Flow (12 months) Enter Company Name Here Fiscal Year Begins: Jan-19 Startup Jan-19 Feb-19 Mar-19 Apr-19 May-19 Jun-19 Jul-19 Aug-19 Sep-19 Oct-19 Nov-19 Dec-19 Total Item EST Cash on Hand beginning of month 191544 176.544 207.519 236,694 238.369 275.944 308.169 339,644 363.369 338,544 432.154 463.684 494,659 176.544 CASH RECEIPTS Cash Sales 65,000 65,000 68,000 73.000 75.000 78,000 82.000 85.000 85,700 85,800 87.000 30.000 333,500 TOTAL CASH RECEIPTS 65,000 65,000 68,000 73.000 75.000 78,000 82.000 85.000 85,700 85,800 87.000 30,000 339.500 Total Cash Available before cash out) 191.544 241.544 272.519 304,694 311369 350,344 386,169 421844 448,369 484,244 517.954 550,684 584659 1116,044 CASH PAID OUT Purchases inventory 11,000 11000 13.000 16,000 20.000 22.000 24.000 26.000 28.000 30.000 34.000 245.000 Polepenses Itawes, etc.) 0 15.000 15,000 15,000 15,000 15,000 15,000 15.000 15.000 15.000 15,000 15.000 15,000 15.000 Supplies (office & oper) 3.000 3.200 3,400 3.700 3.500 3.500 3.550 3.550 3.700 3,700 3.750 3.750 42.300 Repairs & maintenance 2.000 2.600 2.300 300 4.250 4.000 3.700 3.250 3.365 3.545 3.250 3.100 38.360 Advertising 1.000 1,000 1.000 1.000 1000 1.000 1000 1000 1000 1.000 1.000 1.000 12,000 Rent 1.700 1.700 1700 1700 1700 1.700 1700 1.700 1700 1700 1700 1.700 20,400 Telephone 200 200 200 200 200 200 200 200 200 200 200 200 2,400 500 500 500 500 500 500 500 500 500 500 6,000 Insurance 250 250 250 250 250 250 250 250 250 250 250 250 3.000 Tawes (real estate, etc.) 375 375 375 375 375 375 375 375 375 375 375 375 4,500 SUBTOTAL 0 34,025 35.825 35.725 36,025 42.775 46.525 48,275 49,825 52,090 54,270 56,025 59,875 388,360 Other startup costs 15,000 15,000 Owners' Wihdrawal 30,000 10.000 25.000 65.000 TOTAL CASH PAID OUT 15.000 34,025 35.825 65.725 36,025 42.775 46.525 58.275 49.825 52.030 54.270 56.025 84.875 468.960 Cash Position lend of month 176,544 207.519 236,694 238,969 275,944 308,169 339,644 363,369 338.544 432.154 463.684 494,659 499,784 647,084 500 500 ESSENTIAL OPERATING DATA (non cash flow information) Bed Deblend of month) 2,500 2.000 1200 1100 1.200 1.200 1200 1200 1.200 2.000 2,500 3,000 25,800 Jan-18 Jan 18 Mar 18 Apr 18 May-18 Jun-18 Jul 18 Aug.18 Feb Sep-18 Od-18 Nov-18 Doe-18 YEARLY Revenue (Sales) 78,000 65,000 65,000 68,000 73.000 75,000 82,000 85,000 85,700 85 800 90,000 939 500 87,000 85,000 85,700 85,800 87,000 90.000 Total Revenue (Sales) 65,000 65,000 68,000 73,000 75.000 78.000 82,000 939,500 Cost of Sales Inventory Total Cost of Sales 10,000 11000 11,000 13,000 10,000 11,000 11,000 13,000 16,000 20,000 16.000 20,000 22,000 22,000 24,000 24,000 26,000 26,000 28,000 28,000 30,000 30,000 57.000 34,000 34,000 245 000 245.000 61,000 57,800 55,000 54,000 57.000 60,000 59.000 58,000 60.000 Gross Profit 59,700 56.000 694 500 12,000 12,000 12,000 12,000 12.000 15,000 15000 15000 15000 15000 12.000 15.000 12,000 15,000 12.000 15.000 12 000 15,000 12,000 15,000 12.000 15,000 12.000 15,000 144,000 180,000 3.000 3.200 3,400 3.700 3,500 3,500 3.550 3,550 50 3.700 3,700 42,300 3,750 Expenses Salary expenses Payroll expenses Supplies (office and operating) Repairs and maintenance Advertising Rent & Related Costs Telephone 2.000 1,000 1,700 200 500 250 2,600 1,000 1,700 200 500 250 2,300 1.000 1,700 200 500 250 3,000 1,000 1,700 200 500 250 4.250 1,000 1,700 200 500 250 4,000 1,000 1,700 200 500 250 3.700 1,000 1.700 200 500 250 3,250 1,000 1.700 200 500 250 3,365 1,000 1,700 200 500 250 Hewlw 3,545 1,000 1,700 200 500 250 3,250 1,000 1,700 200 500 250 3.100 1,000 1,700 200 500 250 38 360 12,000 20.400 2.400 6,000 3,000 Insurance axes real estate 375 375 375 375 375 36,025 36 825 36,725 37 725 38.775 375 38,525 375 38,275 375 37.825 375 38,090 375 38 270 375 38,025 375 37 875 4,500 452.960 Sub total Expenses Reserve for Contingencies Total Expenses 3828 3603 3683 3673 3773 39,628 40,508 40.398 41,498 3878 42.653 3853 42.378 3783 41.608 3809 41.899 3827 42,097 3803 41,828 3788 41.663 45 296 498,256 42 103 Prolit Before 15,373 13.493 16,603 18.503 16,348 15.623 17.898 19,393 17.801 15,703 15.173 14.338 196.244 deral income Taxes income Taxes come Taxes 3.000 1,000 700 3,000 3,000 1.000 1,000 700 700 11 3,000 1,000 700 3.000 1.000 700 3,000 1.000 700 3.000 1,000 700 3.000 1.000 3.000 1,000 700 3,000 1,000 700 3.000 1,000 700 3,000 1,000 700 3.000 1.000 700.0 700 Operating Income 10.673 8.793 11.903 13,803 11.648 10.923 13.198 14.693 13,101 11,0031 10.473 9.638 191544
Step by Step Solution
There are 3 Steps involved in it

Get step-by-step solutions from verified subject matter experts