

Question: need asap! please use the spss charts. or an example please 1. Obtain a summary of the joint frequencies for values of Loan Purpose and
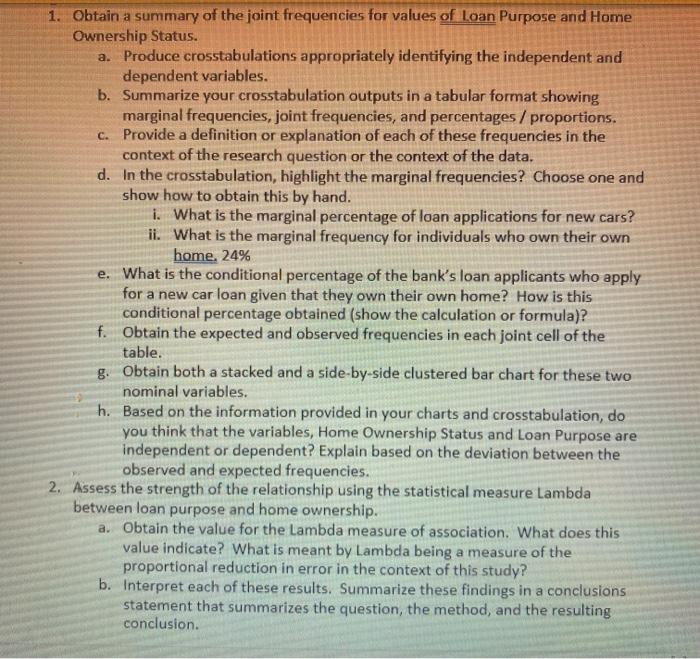
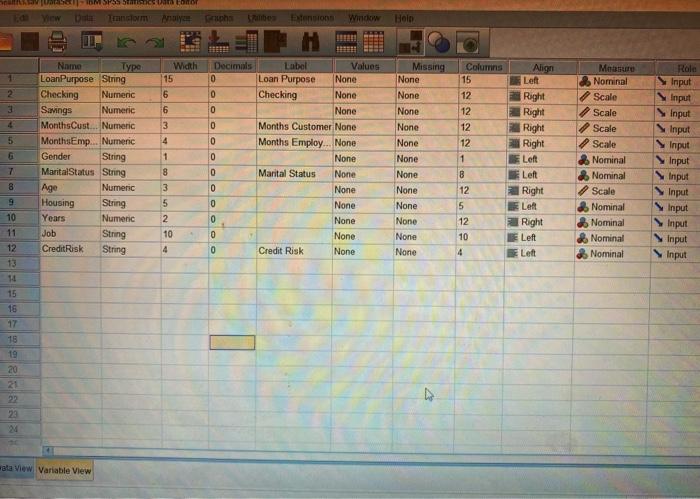
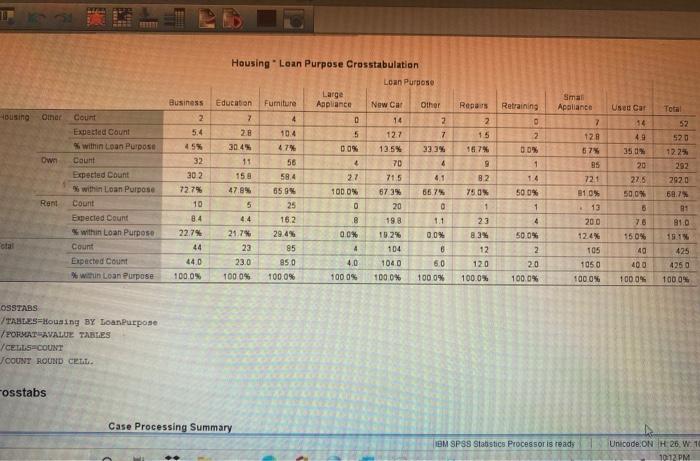
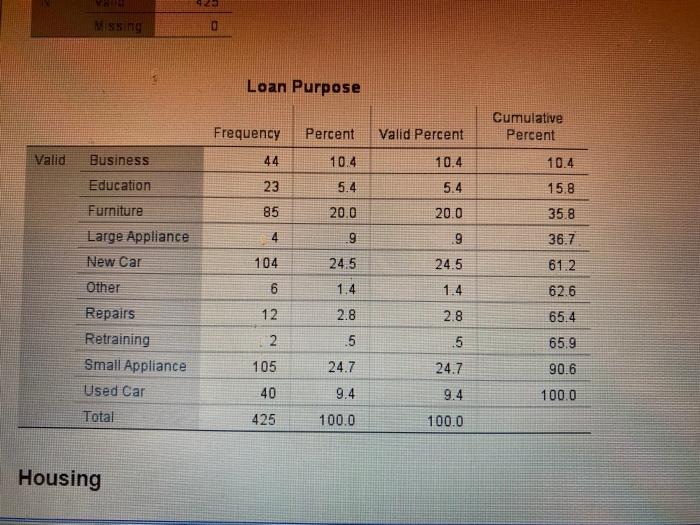
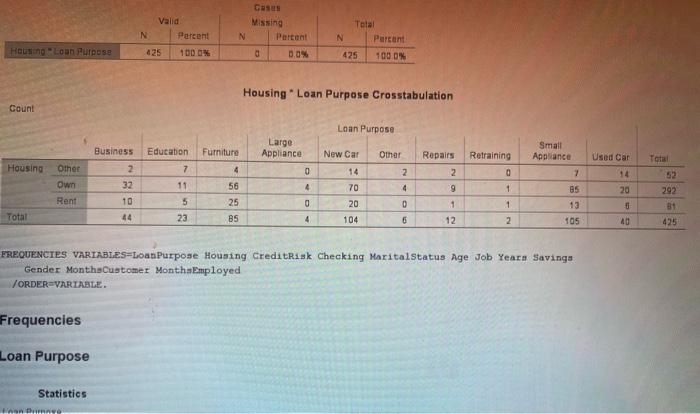
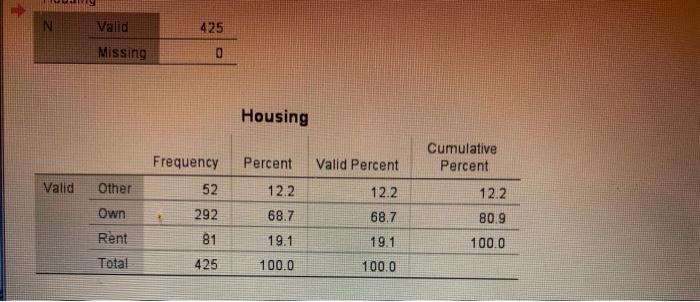
1. Obtain a summary of the joint frequencies for values of Loan Purpose and Home Ownership Status. a. Produce crosstabulations appropriately identifying the independent and dependent variables. b. Summarize your crosstabulation outputs in a tabular format showing marginal frequencies, joint frequencies, and percentages / proportions. C. Provide a definition or explanation of each of these frequencies in the context of the research question or the context of the data. d. In the crosstabulation, highlight the marginal frequencies? Choose one and show how to obtain this by hand. i. What is the marginal percentage of loan applications for new cars? ii. What is the marginal frequency for individuals who own their own home. 24% e. What is the conditional percentage of the bank's loan applicants who apply for a new car loan given that they own their own home? How is this conditional percentage obtained (show the calculation or formula)? f. Obtain the expected and observed frequencies in each joint cell of the table. g. Obtain both a stacked and a side-by-side clustered bar chart for these two nominal variables. h. Based on the information provided in your charts and crosstabulation, do you think that the variables, Home Ownership Status and Loan Purpose are independent or dependent? Explain based on the deviation between the observed and expected frequencies. 2. Assess the strength of the relationship using the statistical measure Lambda between loan purpose and home ownership. a. Obtain the value for the Lambda measure of association. What does this value indicate? What is meant by Lambda being a measure of the proportional reduction in error in the context of this study? b. Interpret each of these results. Summarize these findings in a conclusions statement that summarizes the question, the method, and the resulting conclusion. MUMS Poor Tancom Grupo be Extensions Window Hoin 111811 SED Width 15 Columns 15 1 6 12 2 3 Role Input Input Input 6 12 4 3 4 Name Type LoanPurpose String Checking Numeric Savings Numeric MonthsCust Numeric MonthsEmp... Numeric Gender String Marital Status String Numeric Housing String Years Numeric Job String Credit Risk String Decimals Label Values 0 Loan Purpose None 0 Checking None 0 None 0 Months Customer None 0 Months Employ... None 0 None 0 Marital Status None 0 None 0 None 0 None 0 None 0 Credit Risk None 1 8 3 Missing None None None None None None None None None None None None 12 12 1 Align Left Right Right Right Right Left Left Right Left Right Left Left More Nominal Scale Scale Scale Scale 2 Nominal Nominal Scale & Nominal Nominal Nominal Nominal Input Input Input Input Input Input Input 8 12 Age 5 5 2 10 4 12 10 4 Input Input 5 G 7 8 9 10 11 12 13 14 15 16 17 18 19 20 21 22 22 24 Hata View Variable View Repas Business 2 Retraining Total Housing Oinar Use Car 14 2 1.5 4.9 2 00% Own 1 count Expected Count within Loan Purpose Count Expected Count % within Loan Purpose Count Expected Count within Loan Purpose Count Expected Count % with Loan Purpose 4.5% 32 302 72.7% 10 Housing Loan Purpose Crosstabulation Loan Purpose Large Education Furniture Appliance New Car Other 7 4 0 14 2 28 104 5 127 7 30.4% 474 DON 12.5% 33.3% 19 58 4 70 4 158 59.4 27 715 41 47.8% 659 TODON 6739 66.7% 5 25 0 20 0 4.4 15.2 8 198 21.7* 29.4% 0.0% 19.2% 0.0% 23 85 4 104 8 23.0 850 4.0 1040 60 100 ON 100.0% 1000% 1000W 100.0% 9 82 Y50 Smal Apalance 7 128 57% 35 721 81 0% 13 200 350 20 276 52 520 1225 292 2920 5878 91 81.0 15.1 Rent 30 84 22.79 50 ON 1 4 5005 2 20 100.0% 12.4% otal 23 83% 12 120 1000% 44 105 7.6 150% 40 400 100.0% 425 440 100.0% 4250 1050 1000% 1000 OSSTABS TABLES Housing BY Loan Purpose PORTAVALUE TABLES YCELLSCOUNT JCOUNT ROUND CELL. Fosstabs Case Processing Summary IBM SPSS Statistics Processor is ready Unicode.ON H.26. W. 1 10:12 PM Missing 0 Loan Purpose Frequency Cumulative Percent Percent Valid Percent Valid Business 44 10.4 10.4 10.4 Education 23 5.4 5.4 20.0 15.8 35.8 Furniture 85 20.0 4 .9 9 36.7 Large Appliance New Car 104 24.5 24.5 61.2 6 1.4 62.6 1.4 2.8 12 2.8 65.4 Other Repairs Retraining Small Appliance Used Car .5 65.9 2 105 15 24.7 24.7 90.6 40 9.4 9.4 100.0 Total 425 100.0 100.0 Housing Valid Percent N Cusus Missing Parcent 0.0 N Total N Parent 425 1000 Hong Loan Purpose 425 100.0% Housing Loan Purpose Crosstabulation Count Loan Purpose Business Education Furniture Large Appliance New Car 14 Housing Small Appwance 7 Retraining 0 7 4 Used Car 14 0 Repairs 2 9 Other Own Rent 2 32 11 4 Other 2 4 0 6 1 20 56 25 BS 70 20 10 Total 52 292 31 425 5 0 1 85 13 105 1 5 Total 44 23 4 104 12 2 40 FREQUENCIES VARIABLES=Loan Purpose Housing CreditRisk Checking Marital Status Age Job Years Savings Gender MonthsCustomer Month Employed VORDER-VARIABLE. Frequencies Loan Purpose Statistics en hun N Valid 425 Missing 0 Housing Frequency Percent Valid Percent Cumulative Percent Valid Other 52 12.2 12.2 12.2 Own 68.7 68.7 80.9 292 81 Rent 19.1 19.1 100.0 Total 425 100.0 100.0 1. Obtain a summary of the joint frequencies for values of Loan Purpose and Home Ownership Status. a. Produce crosstabulations appropriately identifying the independent and dependent variables. b. Summarize your crosstabulation outputs in a tabular format showing marginal frequencies, joint frequencies, and percentages / proportions. C. Provide a definition or explanation of each of these frequencies in the context of the research question or the context of the data. d. In the crosstabulation, highlight the marginal frequencies? Choose one and show how to obtain this by hand. i. What is the marginal percentage of loan applications for new cars? ii. What is the marginal frequency for individuals who own their own home. 24% e. What is the conditional percentage of the bank's loan applicants who apply for a new car loan given that they own their own home? How is this conditional percentage obtained (show the calculation or formula)? f. Obtain the expected and observed frequencies in each joint cell of the table. g. Obtain both a stacked and a side-by-side clustered bar chart for these two nominal variables. h. Based on the information provided in your charts and crosstabulation, do you think that the variables, Home Ownership Status and Loan Purpose are independent or dependent? Explain based on the deviation between the observed and expected frequencies. 2. Assess the strength of the relationship using the statistical measure Lambda between loan purpose and home ownership. a. Obtain the value for the Lambda measure of association. What does this value indicate? What is meant by Lambda being a measure of the proportional reduction in error in the context of this study? b. Interpret each of these results. Summarize these findings in a conclusions statement that summarizes the question, the method, and the resulting conclusion. MUMS Poor Tancom Grupo be Extensions Window Hoin 111811 SED Width 15 Columns 15 1 6 12 2 3 Role Input Input Input 6 12 4 3 4 Name Type LoanPurpose String Checking Numeric Savings Numeric MonthsCust Numeric MonthsEmp... Numeric Gender String Marital Status String Numeric Housing String Years Numeric Job String Credit Risk String Decimals Label Values 0 Loan Purpose None 0 Checking None 0 None 0 Months Customer None 0 Months Employ... None 0 None 0 Marital Status None 0 None 0 None 0 None 0 None 0 Credit Risk None 1 8 3 Missing None None None None None None None None None None None None 12 12 1 Align Left Right Right Right Right Left Left Right Left Right Left Left More Nominal Scale Scale Scale Scale 2 Nominal Nominal Scale & Nominal Nominal Nominal Nominal Input Input Input Input Input Input Input 8 12 Age 5 5 2 10 4 12 10 4 Input Input 5 G 7 8 9 10 11 12 13 14 15 16 17 18 19 20 21 22 22 24 Hata View Variable View Repas Business 2 Retraining Total Housing Oinar Use Car 14 2 1.5 4.9 2 00% Own 1 count Expected Count within Loan Purpose Count Expected Count % within Loan Purpose Count Expected Count within Loan Purpose Count Expected Count % with Loan Purpose 4.5% 32 302 72.7% 10 Housing Loan Purpose Crosstabulation Loan Purpose Large Education Furniture Appliance New Car Other 7 4 0 14 2 28 104 5 127 7 30.4% 474 DON 12.5% 33.3% 19 58 4 70 4 158 59.4 27 715 41 47.8% 659 TODON 6739 66.7% 5 25 0 20 0 4.4 15.2 8 198 21.7* 29.4% 0.0% 19.2% 0.0% 23 85 4 104 8 23.0 850 4.0 1040 60 100 ON 100.0% 1000% 1000W 100.0% 9 82 Y50 Smal Apalance 7 128 57% 35 721 81 0% 13 200 350 20 276 52 520 1225 292 2920 5878 91 81.0 15.1 Rent 30 84 22.79 50 ON 1 4 5005 2 20 100.0% 12.4% otal 23 83% 12 120 1000% 44 105 7.6 150% 40 400 100.0% 425 440 100.0% 4250 1050 1000% 1000 OSSTABS TABLES Housing BY Loan Purpose PORTAVALUE TABLES YCELLSCOUNT JCOUNT ROUND CELL. Fosstabs Case Processing Summary IBM SPSS Statistics Processor is ready Unicode.ON H.26. W. 1 10:12 PM Missing 0 Loan Purpose Frequency Cumulative Percent Percent Valid Percent Valid Business 44 10.4 10.4 10.4 Education 23 5.4 5.4 20.0 15.8 35.8 Furniture 85 20.0 4 .9 9 36.7 Large Appliance New Car 104 24.5 24.5 61.2 6 1.4 62.6 1.4 2.8 12 2.8 65.4 Other Repairs Retraining Small Appliance Used Car .5 65.9 2 105 15 24.7 24.7 90.6 40 9.4 9.4 100.0 Total 425 100.0 100.0 Housing Valid Percent N Cusus Missing Parcent 0.0 N Total N Parent 425 1000 Hong Loan Purpose 425 100.0% Housing Loan Purpose Crosstabulation Count Loan Purpose Business Education Furniture Large Appliance New Car 14 Housing Small Appwance 7 Retraining 0 7 4 Used Car 14 0 Repairs 2 9 Other Own Rent 2 32 11 4 Other 2 4 0 6 1 20 56 25 BS 70 20 10 Total 52 292 31 425 5 0 1 85 13 105 1 5 Total 44 23 4 104 12 2 40 FREQUENCIES VARIABLES=Loan Purpose Housing CreditRisk Checking Marital Status Age Job Years Savings Gender MonthsCustomer Month Employed VORDER-VARIABLE. Frequencies Loan Purpose Statistics en hun N Valid 425 Missing 0 Housing Frequency Percent Valid Percent Cumulative Percent Valid Other 52 12.2 12.2 12.2 Own 68.7 68.7 80.9 292 81 Rent 19.1 19.1 100.0 Total 425 100.0 100.0
Step by Step Solution
There are 3 Steps involved in it

Get step-by-step solutions from verified subject matter experts