

Question: Need assistance coming up with null and alternative hypothesis for given data, along with choosing which test to run (one-sample z, t-test, ANOVA, linear regression,
Need assistance coming up with null and alternative hypothesis for given data, along with choosing which test to run (one-sample z, t-test, ANOVA, linear regression, or chi-square) and why.
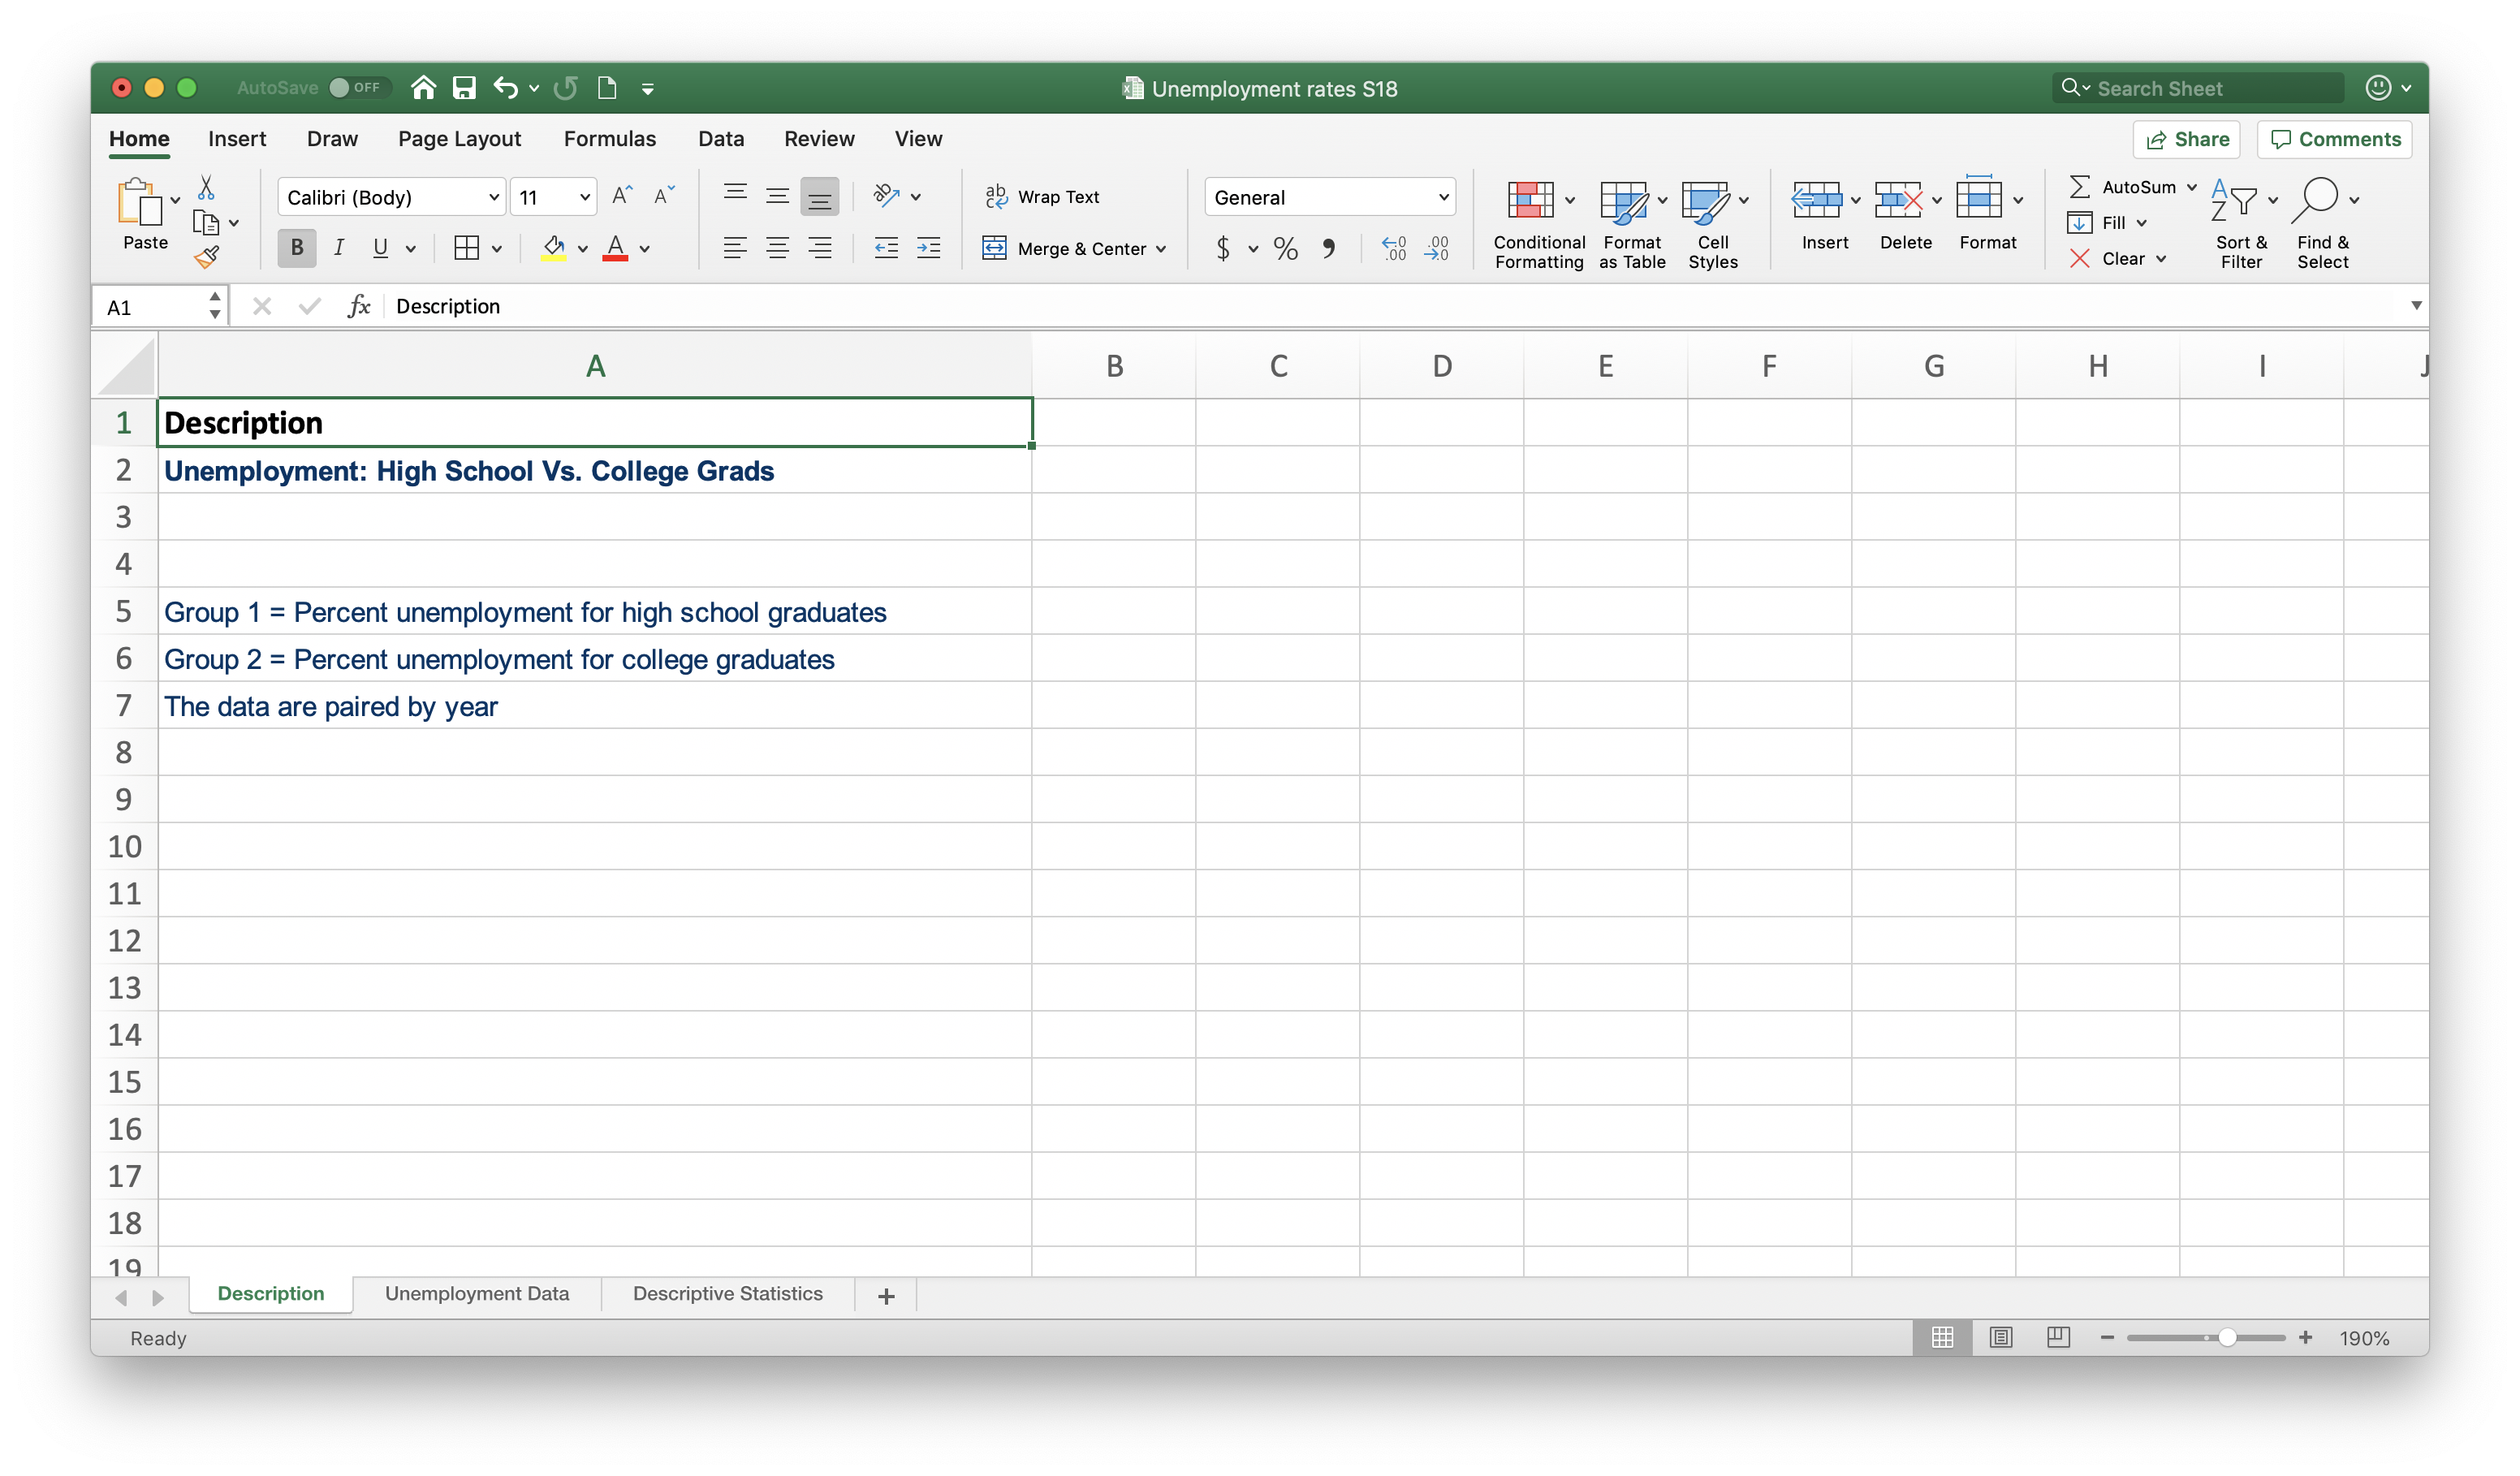
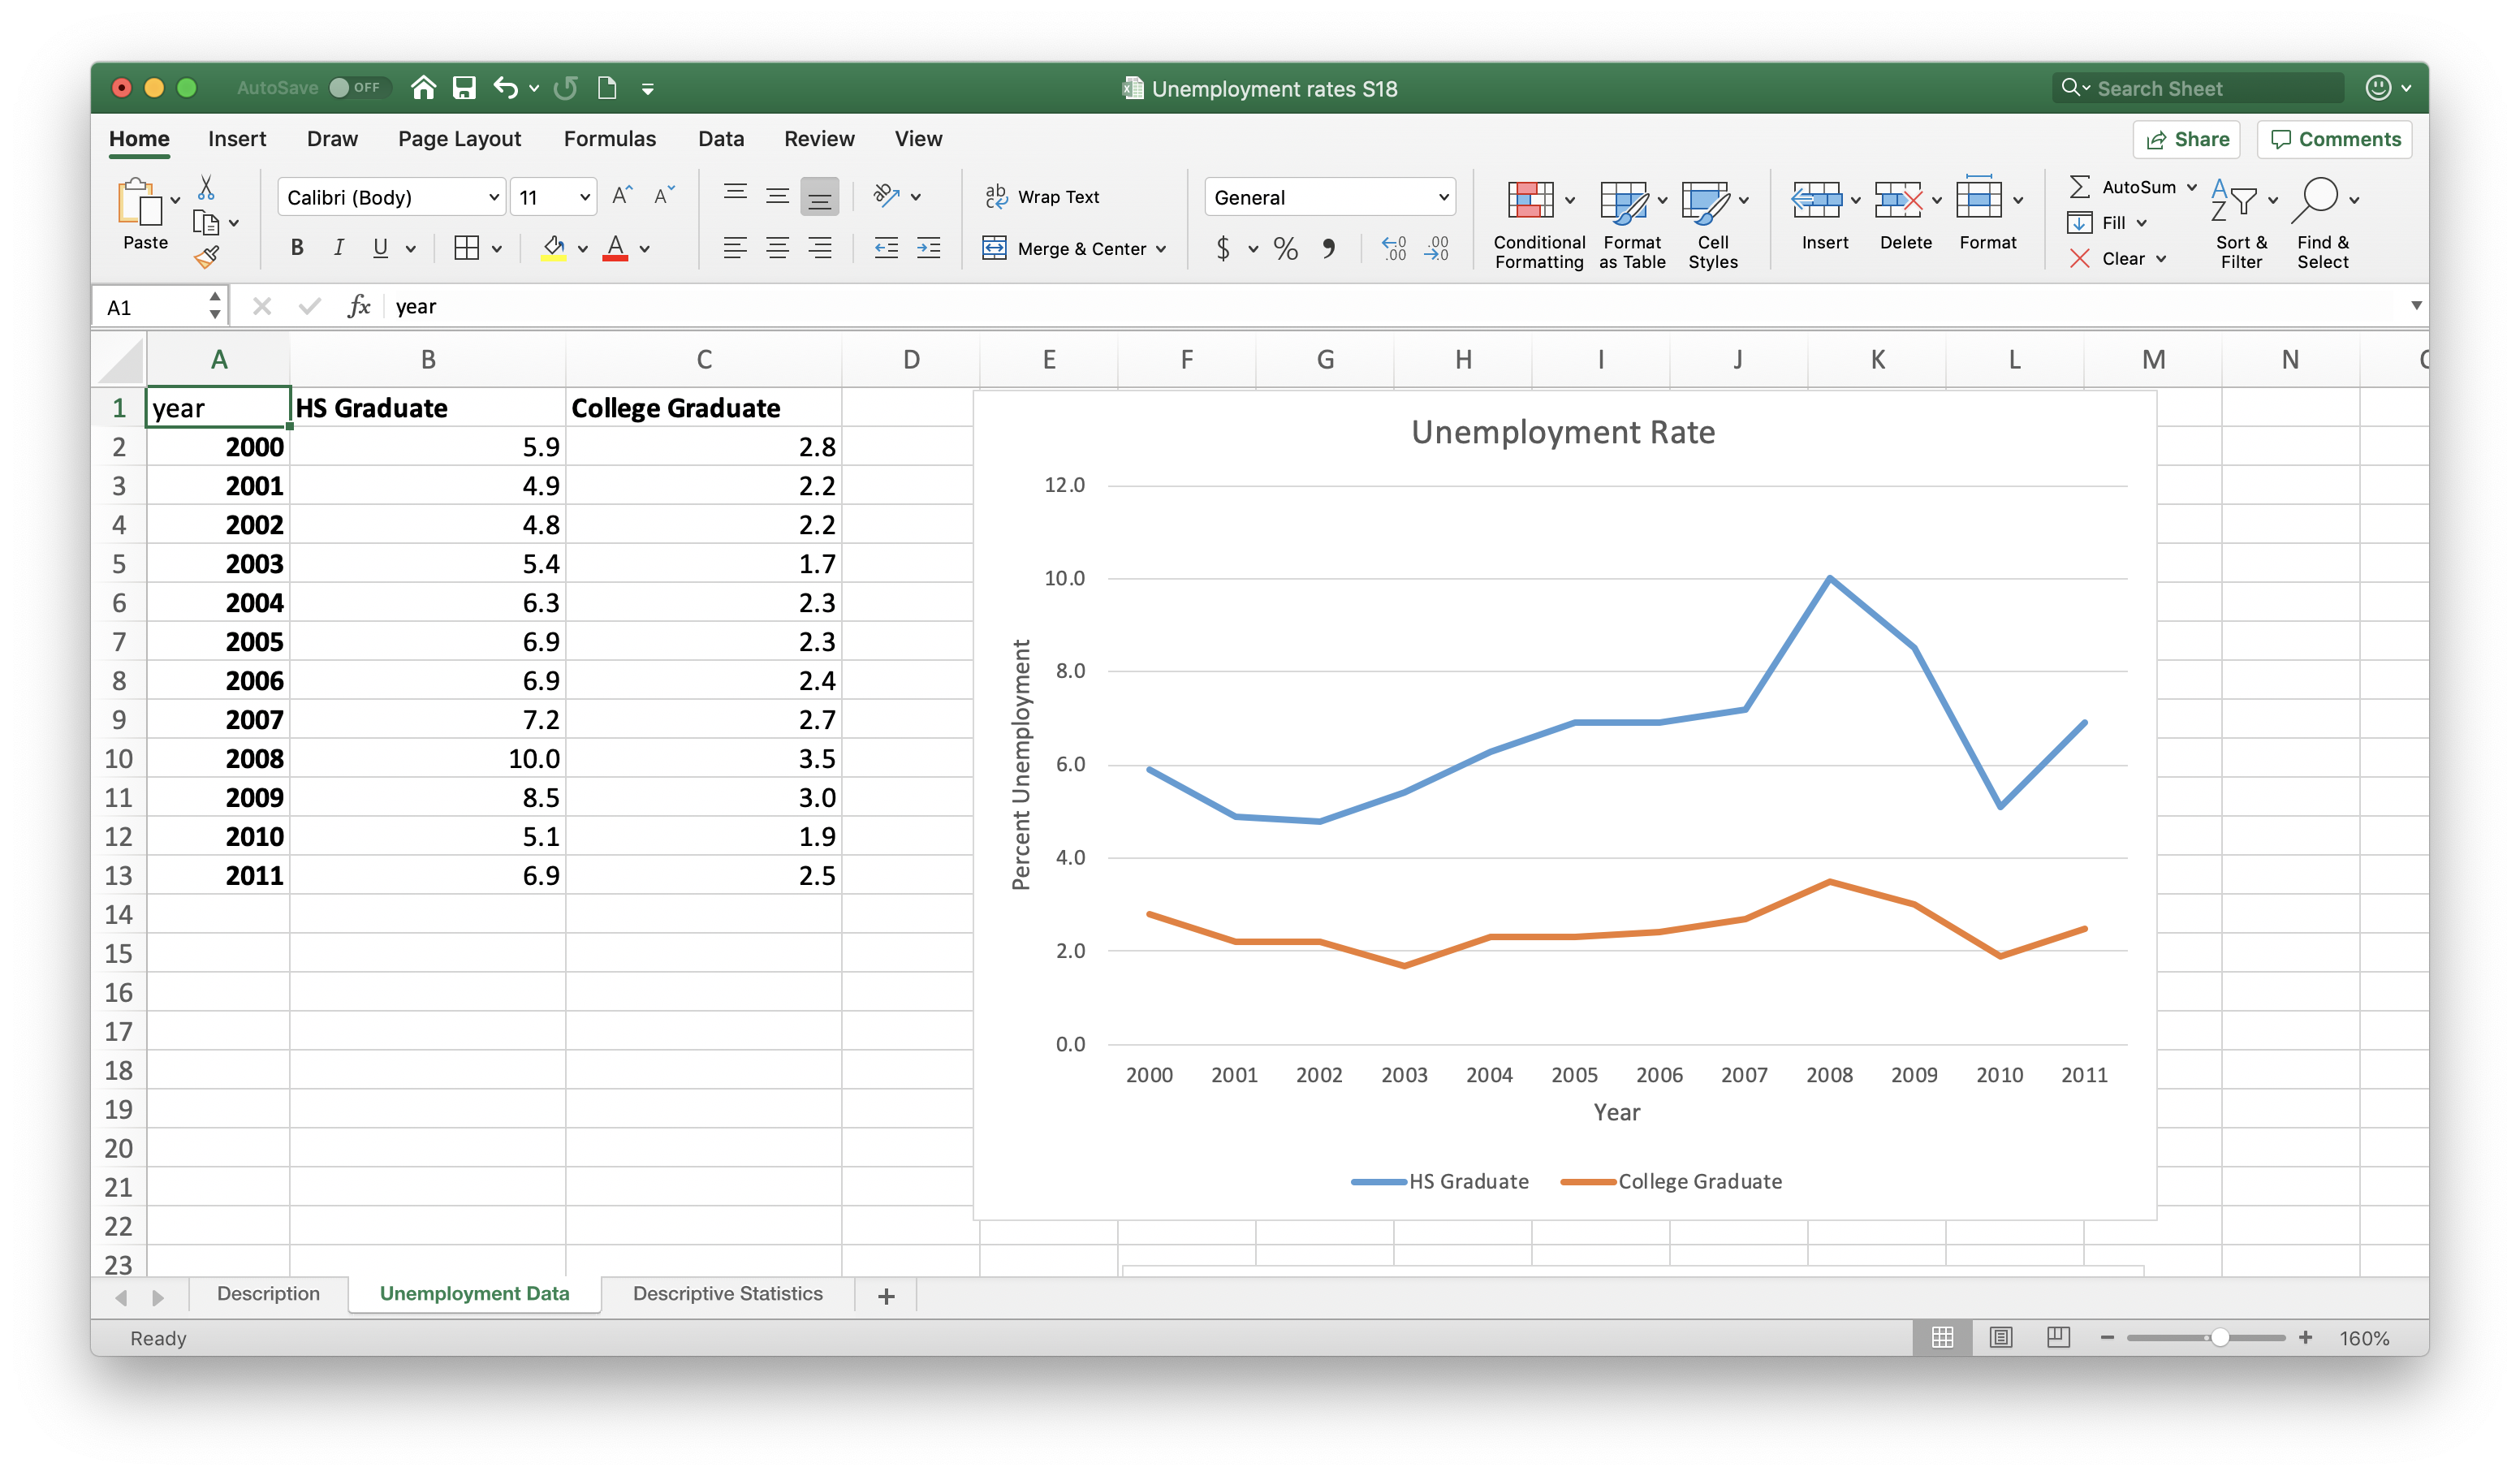
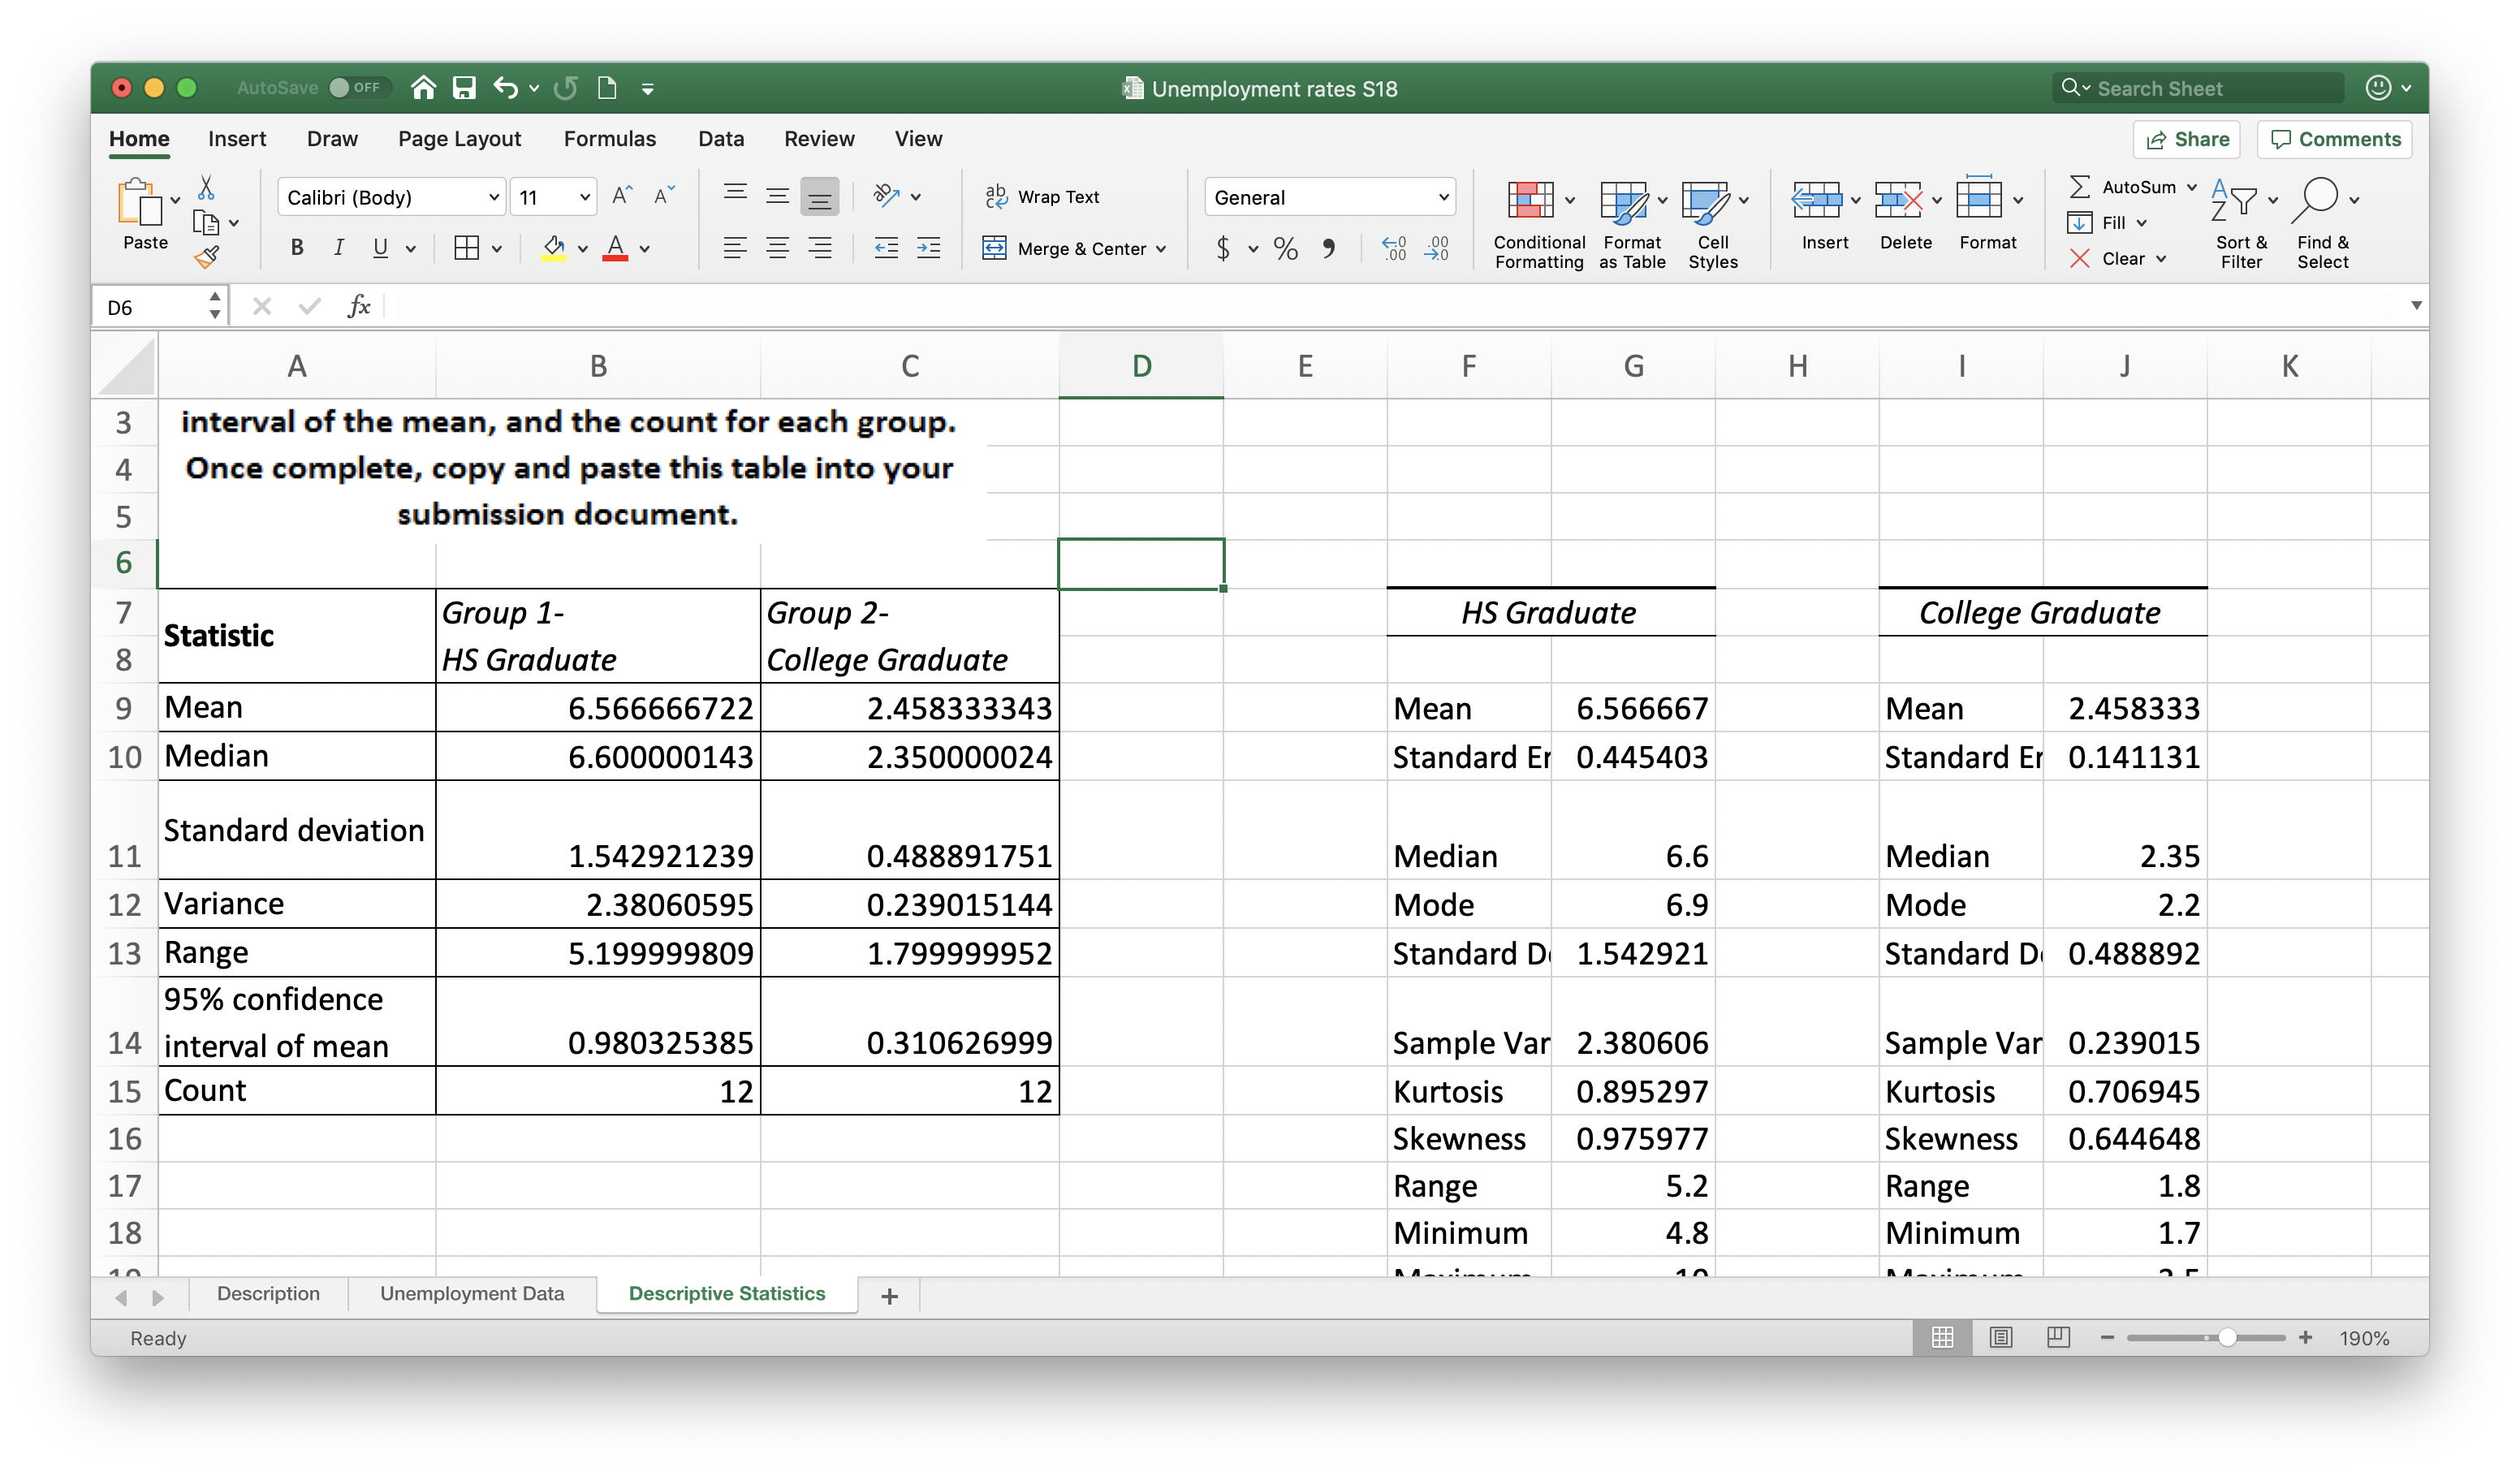
` ) 0 0 `` GENE JOKE)` ` Wield Oyuela {les STE Draw Page Layout Review View 1}} Share\\ [ Comments Hasul Home Formulas Data\\ Do Calibri ( Body ) ~| 11 ~| A " A` = 2 7 v ab Wrap Text General 2 AutoSum " AS [I] Fill v U V Paste B I U V V ` v A v = = = = {\\ Merge & Center V ~ % 9 $80 9.0 Conditional Format Cell Insert\\ Delete\\ Format X Clear V Sort & Find & Formatting as Table\\ Styles Filter Select AI ~| X V for Description A B C D E F G H Description Unemployment : High School VS . College Grads 4 5 Group 1 = Percent unemployment for high school graduates* 6 Group 2 = Percent unemployment for college graduates* The data are paired by year 8 9 10 U D W N E 16 17 18 19 \\ Description\\ Unemployment Data\\ Descriptive Statistics\\ + Ready + 190 %` ) 0 0 `` GENE JOKE)` ` Wield Oyuela {les STE Home Insert* Draw Page Layout Formulas Data Review View 1}} Share\\ - Comments Calibri ( Body ) ~| 11 ~| A " A` 2 7 v ab Wrap Text General LIT 2 AutoSum v AC] [I] Fill V U V Paste B I U V| HAV|` ` v A V {\\ Merge & Center V Conditional Format Cell Insert\\ Delete\\ Format X Clear V Sort & Find & 105 : 0 'S 16 % ~ $ Formatting as Table Styles Filter Select AI \\ X V for year A B C D E F G H K L M N I year HS Graduate College Graduate 2 2000 5. 9 2.8 Unemployment Rate 3 2001 4 .9 2 . 2 12.0 4 2002 4. 8 2 . 2 2003 5.4 1 .7 10. 0 2004 6 . 3 2.3 2005 6 .9 2.3 8 2006 6 .9 2 .4 8.0 9 2007 7.2 2 . 7 10 2008 10.0 in !` Percent Unemployment 6. 0 11 2009 8.5 12 2010 5 . 1 13 2011 6 . 9 2.5 4. 0 14 15 2.0 16 17 0. 0 18 2000\\ 2001\\ 2002\\ 2003\\ 2004\\ 2005\\ 2006\\ 2007 2008\\ 2009\\ 2010 2011 19 Year 20 21 - HS Graduate* - College Graduate* 22 23 Description\\ Unemployment Data Descriptive Statistics\\ + Ready 160%` ) 0 0 `` GENE JOKE)` ` Wield Oyuela {les STE Home Insert* Draw Page Layout Formulas Data Review View 1}} Share\\ [ Comments Calibri ( Body ) ~| 11 ~| A " A` = = 2 7 v ab Wrap Text General LIT 2 AutoSum " AS [I] Fill v U V Paste 16 % " B I U V| HAV| AV AV FE JE {\\ Merge & Center V $80 9.0 Conditional Format Cell Insert\\ Delete\\ Format Formatting as Table Styles * Clear V Sort & Find & Filter Select DO + | X V for A B C D E F G H K interval of the mean , and the count for each group . 4 Once complete , copy and paste this table into your* 5 submission document . 6 Statistic Group 1 - Group 2 - HS Graduate College Graduate 8 HS Graduate College Graduate* 9 Mean 5. 56 6 6 6 6722 2. 4583 3 3 343 Mean 6.566667 Mean 2. 4583 3 3 10 Median 6. 6000 0 0143 2. 350000024 Standard Er 0. 4 45403 Standard Er 0. 1 4 1 131 1 1 Standard deviation 1. 542921239 0. 48889175 1 Median 6. 6 Median 2.35 12 Variance 2. 38060595\\ 0. 239015144 Mode 6. 9 Mode 2 . 2 13 Range 5 . 19 9 9 9 9809 1 . 79 9 9 9 9 952 Standard Di 1.542921 Standard Di 0. 488892 95% confidence 14 interval of mean 0. 980325385 0. 3 10626999 Sample Var 2.380606 sample Var O. 239015 15 Count 12 12 Kurtosis 0 . 895297 Kurtosis 0 . 706945 16 Skewness 0 . 97597 7 Skewness 0 . 64 4648 17 Range 5 .2 Range 1 .8 18 Minimum 4.8 Minimum 1 . 7 _ _ An -.. . ...` an An . . . . ..` TUV 1 Description\\ Unemployment Data\\ Descriptive Statistics* + Ready - 190 %
Step by Step Solution
There are 3 Steps involved in it

Get step-by-step solutions from verified subject matter experts