

Question: need b & c 2. The projected net cash flows for two properties (A and B) are shown in the following table: Annual Net Cash
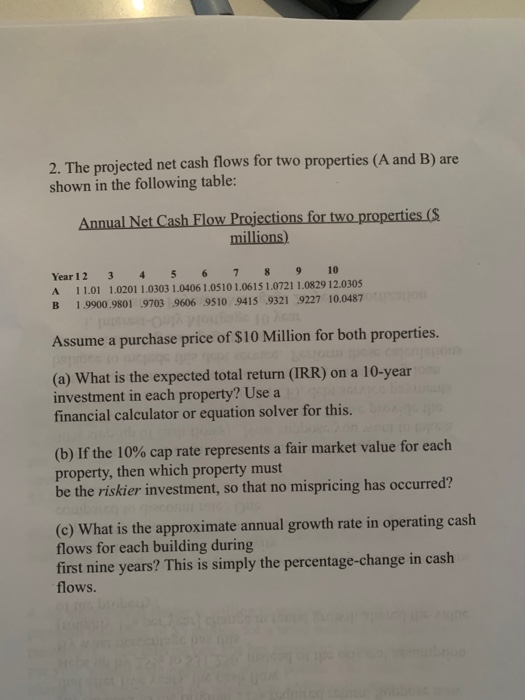
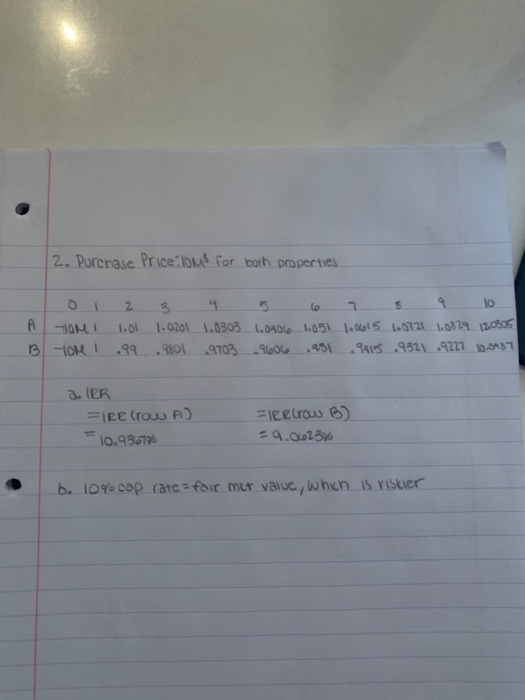
2. The projected net cash flows for two properties (A and B) are shown in the following table: Annual Net Cash Flow Projections for two properties ($ millions) Year 1 2 3 4 5 7 8 9 10 A 11.01 1.0201 1.0303 1.0406 1.0510 1.0615 1.0721 1.0829 12.0305 B 1.9900.9801 9703 9606 9510 9415 9321 9227 10.0487 Assume a purchase price of $10 Million for both properties. (a) What is the expected total return (IRR) on a 10-year investment in each property? Use a financial calculator or equation solver for this. (b) If the 10% cap rate represents a fair market value for each property, then which property must be the riskier investment, so that no mispricing has occurred? (c) What is the approximate annual growth rate in operating cash flows for each building during first nine years? This is simply the percentage-change in cash flows. 2. Porenase Price omd for both properties A TOMI 13 OK 2 1.01 . 3 4 2 5 10 1.0201 1.0303 1.0406 1.051 1.0615 1.0721 1.0829 120305 .9801 9703.9606.951 9415.9921 .9227 10.0987 2. IER =ire (row A) 10.936796 =leelow B) = 9.062396 b. 10% cap rate for mit value, which is riskier
Step by Step Solution
There are 3 Steps involved in it

Get step-by-step solutions from verified subject matter experts