

Question: Need below information based on the data provided in the attached pictures- What aspects of the P&G organizational structure and Global Business Services (GBS) analytical
Need below information based on the data provided in the attached pictures-
- What aspects of the P&G organizational structure and Global Business Services (GBS) analytical capabilities would provide confidence to a Product Manager/Business Leader in their decision making?
- What shortcomings or pitfalls do you see in P&G structure?
- What do you think is driving the unexpected jump in powdered detergent sales and the greater than anticipated jump in liquid detergent?
- Would you make any changes to the existing product forecasts?
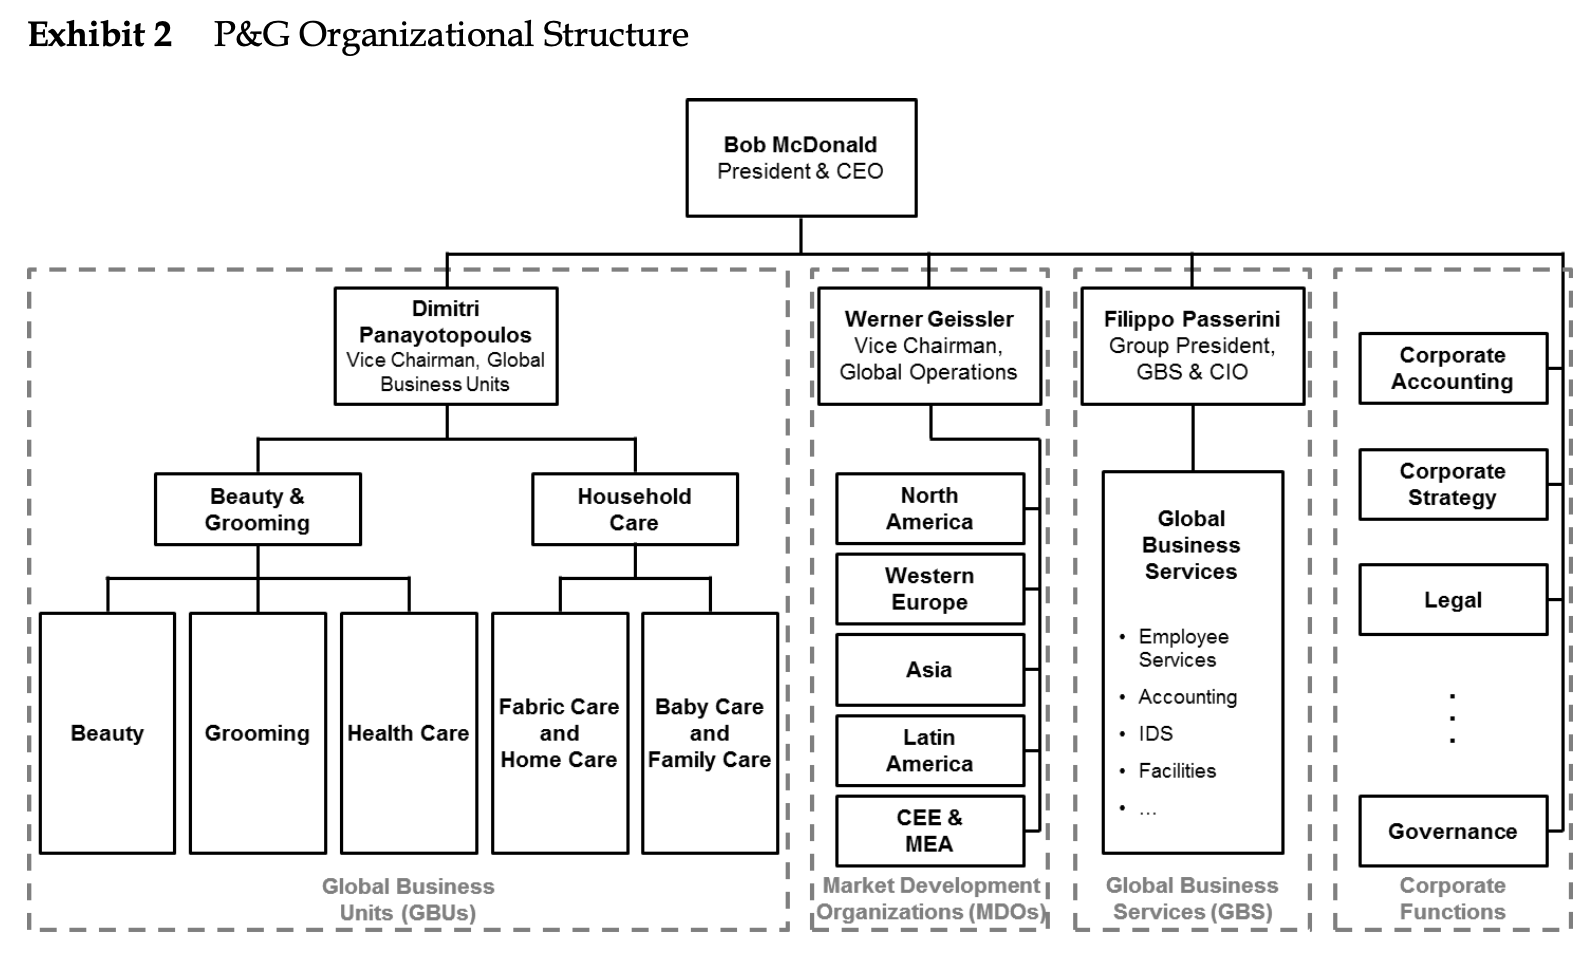
P&G had introduced a more concentrated, also called compacted, powder laundry detergent in Target stores at the end of February 2011 and results from the first two months were better than anyone had expected. Data collected by P&G was seamlessly integrated so that Torres and Wright could simply click on higher level data to drill down and view performance by brand, initiative, retailer, and, in some cases, individual store. In addition, statistical forecasts for the next twelve months were automatically updated and made available. Equipped with these tools, Wright led Torres through a series of charts and graphs that showed a three percent increase in the overall detergent category in the stores where the compacted detergents were introduced. Torres had anticipated that the compacted format would provide a slight boost to the mature $8.5 billion North America laundry detergent market, where growth rarely exceeded 2%. But the market had contracted by 2% in 2010 after a gain of just 1% in 2009, so growth of over 2% was beyond all expectations. Even more surprising, P&G's powder detergent sales jumped 12% as the company's market leading brands, including Tide, Gain, and Cheer, gained market share. P&G already held more than a 50% share of the North America laundry detergent market that generated over $4 billion in revenue for the company in 2010. Compacted detergents were set to be introduced throughout the rest of N America in the coming months and Torres was cautiously optimistic about the impact they would have on the overall market and on P&G sales. The statistical models used to produce market size and P&G sales forecasts did not fully account for the market disruption caused by the introduction of compacted detergents and continued to produce forecasts that showed growth of 1% for the 2011 calendar year. Procter & Gamble Overview and Organization Following the restructuring, P&G's 129,000 employees were organized into four independent global organizations: (Exhibit 2) Global Business Units (GBUs) The primary driver of commercial activity at P&G was the GBU. The product line-based GBUs had primary responsibility for developing strategy, building brands, manufacturing products, developing and bringing to market innovations, contending with competitors, and delivering profits. By centralizing at the global level, GBUs were better able to standardize manufacturing processes, coordinate marketing activities, build global brands, identify significant innovations and bring new products to market quickly. Market Development Organizations (MDOs) By maintaining a local presence, the MDOs provided P&G with the knowledge and relationships required to compete locally in each geographic region. MDOs were responsible for understanding the preferences of local consumers and retailers so that the global initiatives and brands of the GBUS could be tailored for local markets. Global Business Services (GBS) Business support services including accounting, payroll, employee services, information technology, order management, and logistics were moved into the newly formed GBS. Prior to the reorganization, these functions were duplicated in each unit. In centralizing these activities, P&G looked to gain efficiencies through scale, standardization of shared services and the transfer of best practices across the organization. Corporate Functions Corporate accounting, legal, communications, governance, corporate strategy, and other corporate support functions were provided by a lean Corporate Functions group. GBS functioned as a service to the GBUs and MDOs across P&G. As the company's back office, GBS looked to provide the high quality services required by its internal customers "at lowest cost and with minimal capital investment." GBS had to break even each year, and, therefore, could only supply services that were valued by the GBUS and MDOS. Passerini, whose title was augmented to include CIO, renamed these essential IT activities "Information and Decision Solutions." (IDS) befitting the group's support for decision processes around P&G. IDS built up its human and technical capabilities for decision support and analytics in both the supply chain and the sales and marketing domains. IDS also worked throughout the decade of the 2000s to consolidate systems and integrate them into a much smaller set of global platforms. Analytics at P&G "We see business intelligence as a key way to drive innovation, fueled by productivity, in everything we do. To do this, we must move business intelligence from the periphery of operations to the center of how business gets done. Passerini, however, envisioned a much larger role. IDS, he proposed, would support business leaders by performing much of the analytics and by making data as accessible as possible. The P&G website described the division's broad role, "IDS are a key business enabler that advances technology tools, strategic development, collaboration, and decision making. in July 2009, Bob McDonald became the CEO, of P&G. Having studied operations research, computer science, and engineering at West Point, McDonald shared Passerini's enthusiasm for data and analytics. McDonald emphasized the holistic nature of this transformation. "Moving business intelligence to the center of how business gets done is absolutely critical, as business analytics is a new way to win in the marketplace. And, it is going to be the tools, the talent, and the culture, not just the data, which are the true competitive advantages to driving business value." Analytics as a Centralized Service IDS automated the generation of many reports that were used across multiple business units. In addition to simplifying the task of retrieving data and performing some basic analyses, the reports served to standardize the way data was visualized across the company. The same types of charts and graphics used to track sales and market share of Old Spice deodorant in the US were also used to monitor lams dog food in the Philippines and Oral-B toothbrushes in Brazil. With consistent visuals, analysts and managers from one unit could step into a role, or even a meeting, with a different product or region and quickly understand the situation. The centralized IDS team also acted as a hub for sharing analytic techniques and ideas. Data and Enabling Technologies IDS focused on building out scaled solutions that could be performed centrally and leveraged in multiple markets. One of the first solutions by IDS was the Decision Cockpit, a web-based customizable dashboard that tracked the most relevant data and news for each individual employee. Each user was able to specify the data and reports displayed on their personal dashboard and could set alerts if data were outside of a specified range or if important information, like a competitor product introduction, became available. Linked to the centralized data warehouse, the dashboards were immediately updated as soon as new data or information became available, allowing managers to be notified and react in real-time. Decision Cockpit displayed a more granular version of the same data or other related data that enabled users to rapidly identify the "what" and understand the "why." For example, if a manager noticed a drop in sales of Gillette Fusion razors in Australia, the "what," she could quickly understand the "why" by looking at sales by city or retailer, shipments, prices, promotions and competitor actions. she could check if the overall market dropped or just the P&G brand. She could also check if a particular retailer decreased orders, or customers purchased lower quantities. As easily, she could investigate if there were changes in pricing, if a competitor came out with a new product or launched a new marketing campaign. With much less time needed to identify the "what" and understand the "why," leaders were able to quickly move to the crucial decision making of "how" to fix of maintain improved performance. IDS worked with P&G business units, suppliers, customers and external vendors, such as Nielsen and IRI, to collect data about the "what," "why" and "how." To collect data from social media, IDS developed Consumer Pulse, which provided real-time sentiment analysis for web buzz of each P&G brand. It leveraged best-in-class technology, including approaches used by the intelligence community. For mgmt teams, P&G developed a physical environment for information based decision making called the Business Sphere. Most noticeable was the surrounding set of two oversize 8-foot by 32-foot screens to display visualizations of data and analyses. Passerini explained that the Business Sphere provided an environment that was "physically surrounding business leaders with the data they need to make actionable decisions. Forecasting and Business Sufficiency Models P&G employed two types of statistical models for forecasting. The 1st type, time series based forecasting. These models forecasted using previous results as well as macroeconomic conditions and other basic inputs. Although outputs were precise, this set of models provided little insights as to why the outcome would occur. Propensity models, on the other hand, attempted to better understand the causes, or drivers, of the outcomes. By including information on drivers such as new product introductions, marketing campaigns, and competitor actions, propensity models served as useful tools to measure the potential impact of management actions. The forecasts and ranges were extended to a set of seven "Business Sufficiency Models" developed by IDS in conjunction with executives. These models captured the most recent data and conducted a large number of simulations to provide leaders with a measure of the likelihood that the business would be able to deliver on previously set goals and targets. Areas that seemed unlikely to meet objectives were highlighted so that leaders could quickly move to explore actions of "how" to rectify the situation and alert other parts of the organization that may be impacted. The business sufficiency models addressed key business domains for P&G, including product, customer, supply chain, distribution channels, human resources, and the "Top 50" global product market combinations. Forecasting and Business Sufficiency Models P&G employed two types of statistical models for forecasting. The 1st type, time series based forecasting. These models forecasted using previous results as well as macroeconomic conditions and other basic inputs. Although outputs were precise, this set of models provided little insights as to why the outcome would occur. Propensity models, on the other hand, attempted to better understand the causes, or drivers, of the outcomes. By including information on drivers such as new product introductions, marketing campaigns, and competitor actions, propensity models served as useful tools to measure the potential impact of management actions. The forecasts and ranges were extended to a set of seven "Business Sufficiency Models" developed by IDS in conjunction with executives. These models captured the most recent data and conducted a large number of simulations to provide leaders with a measure of the likelihood that the business would be able to deliver on previously set goals and targets. Areas that seemed unlikely to meet objectives were highlighted so that leaders could quickly move to explore actions of "how" to rectify the situation and alert other parts of the organization that may be impacted. The business sufficiency models addressed key business domains for P&G, including product, customer, supply chain, distribution channels, human resources, and the "Top 50" global product market combinations. The Role of Embedded IDS Analysts IDS embedded analysts within the business units, each alongside with leaders and managers of a particular team on a daily basis. In some cases, the embedded IDS analyst was member of the business unit's leadership team. The analyst was responsible for bringing technology, visualization, and automated alerting functions to the business unit. They were responsible for integration across diverse data domains and models. They were required to develop analytical models driving forward-looking insights and simulations within and across the business domains they supported. And, they led market performance review meetings in the Business Spheres, guiding business unit managers and leaders through the "what" and the "why" and providing on-the-fly analysis of the "how" actions proposed. Impact on the Culture of P&G Passerini hoped that real-time availability of information would lead to real-time decisions and actions by decision-makers and "radically increase the pace at which they do business." 23 IDS had worked with human resources on how best to manage this cultural transformation, one leader at a time. The embedded IDS analysts provided coaching to the business leaders on how to use the new management tools effectively. The North America Laundry Detergent Market The North America detergent sector was one of the largest and most important markets for P&G. The total market was estimated to be $8.5 billion at the retail level in 2010. By all measures, the laundry detergent market was mature and showed little growth. Penetration was very high as virtually all households in North America used laundry detergents. Growth was driven primarily by population increases, which averaged about 1% per year. The previous two years had been particularly challenging as annual market growth was 1.1% and -2.2% in 2009 and 2010, respectively. Overall, the market grew with an average annual rate of 1.5% between 2000 and 2010. During that span, the gradual change in consumer preference from powder detergents to liquid detergents continued and, by 2010, powders represented just 15% of the market. As a result, the $1.3 billion powder laundry detergent market in North America contracted at an average rate of 4% per year over the previous 5 years. P&G was far and away the market leader with a 58% value share of the North America laundry detergent market, and the company owned both of the top two selling brands. 30 Introduced in 1946, P&G's Tide became the best-selling detergent in the US in 1949 and had continued to be the most popular brand since. 31 Tide captured 42% of the market by value in 2010 and maintained a premium pricing over nearly all of the competitor brands. The fresh-scented Gain brand, first developed by P&G in 1969, was particularly strong in the southern US and held the number two position with 10% of the total market. In addition, P&G marketed the Cheer, Era, Dreft, and Ivory brands of laundry detergent, each of which held 2% or less of the total market. 32 (Exhibit 7) In total, the North America laundry detergent market generated in excess of $4 billion in revenue for P&G in fiscal 2011. Powder Laundry Detergent Compaction Laundry detergent boxes were bulky and took up a lot of valuable space on retailer shelves. Retailers, including Target and Walmart, worked with manufacturers to find ways to deliver the same cleaning power in smaller and lighter forms. Increasing the concentration level of detergents appealed to both producers and consumers as well. Producers would require less packaging materials and would save significantly on transportation and warehousing costs. Consumers would be better served with a product that was easier to carry and maneuver. In addition, the reduction in packaging, water usage, and transportation would be beneficial to the environment. Although the benefits to all parties were quite clear, most manufacturers hesitated in bringing compacted products to market. Many worried that consumers would not believe that the smaller doses would be as effective in cleaning laundry. P&G North America Compaction Roll Out In Sep 2010, P&G executives decided to introduce 1/3 compacted powder laundry detergents in the following year. Torres elected to stop producing the standard formulation and to supply all P&G brands and varieties in compacted form only. The compacted products were branded "Ultra" and prices were adjusted so that the consumer cost per wash-load remained about the same. A 56 ounce carton of the new Ultra Tide was 20% lighter than a 70 ounce box of the standard non-compacted Tide and was 33% smaller in size, but both would wash 40 loads of laundry. Torres and his team did not anticipate that the introduction of compacted products would have any significant impact on overall market growth, since consumers would still wash the same number of loads. There was some debate around the way customers would respond to the compacted detergents. Customers that were skeptical of the compacted detergent's cleaning ability could switch to competitor products that were not compacted. On the other hand, other customers might find compacted products more convenient and environmentally-friendly and increasingly choose the concentrated P&G products. To measure consumer response to the new formulations, Cedar Rapids, lowa served as a test market for the compacted products in the winter of 2010. All P&G powder laundry detergents were replaced with the compacted varieties in the city of a couple of hundred thousand people where no other competitors offered concentrated formulations. Consumers seemed comfortable with the shift to the concentrated detergents and, during the two-month trial, P&G saw a modest increase in powder detergent sales of just under 3%. To ease the changeover, Torres planned to introduce the compacted detergents in three waves. In Wave 1, compacted detergents were to be released to Target and a few other selected retailers in February 2011. Next, Wave 2 would bring compacted detergents to most of the major discount retailers, supermarkets and online retailers beginning June 2011. Finally, the remaining retail and distribution channels would be converted to compacted detergents in August 2011 in Wave 3. By the end of April, IDS compiled data that provided a clearer picture of the consumer response. On the screens of the Business Sphere, Wright presented the surprising increase in sales to Torres and the North America Laundry Care leadership team. Total category sales in the stores covered by Wave 1 increased by slightly above 2% over the same period the year prior. Powder laundry detergent sales jumped 8% as customers increased purchases and stemmed the shift from powder to liquid. Sales of powdered Tide, Gain, Cheer and other P&G laundry detergent brands improved by 12% and P&G gained a couple of percent market share in the powder segment. In comparison, the laundry detergent sales at retailers that were not part of Wave 1 showed no growth during that time and P&G market share was virtually unchanged. Forecasting the Impact of P&G's Compaction Rollout The forecasts that had been produced by IDS before the start of Wave 1 showed the category achieving 1% annual growth. Updated with the actual results of March and most of April, the statistical forecasting models produced slightly higher forecasts for Wave 1 and showed no change for Wave 2 and Wave 3. Wright explained to the Fabric Care leadership team that the statistical models did not account for the disruptive changes in the market. The models for Wave 1 responded to what seemed to be an unanticipated increase in market volumes and P&G market share, uninformed of the introduction of compacted detergents. In addition, the models were not built to incorporate Wave 1 results into the forecasts for Wave 2 and Wave 3; therefore, the statistical forecasts for those groups of retailers did not contain any adjustments for the planned compaction launches. The disruptive change and impact of compaction could not be ignored and Torres wondered if he should override the statistical forecasting models and make adjustments to the forecasts. But he was not sure what adjustments to make even if he decided to do so. Would the increase in the overall market and P&G's market share be sustained in the Wave 1 retailers? Or was it a temporary effect of the shift to compaction? Would similar results be seen in the other waves? A change in forecast had a much broader impact than just a modification to the North America Fabric Care annual plan. The forecasts were available to all through the Decision Cockpit and a significant modification would draw the attention of several groups. Each additional 1% increase in powder laundry detergent sales improved P&G revenue by over half a million dollars per month. A 10% increase would result in $65 million in annual top-line gains and surely be noticed by the finance team and company leadership. The production plants would have to produce an additional 35,000 boxes containing 275,000 pounds of compacted detergent per month to supply each 1% increase. The procurement, manufacturing, and supply chain teams were already under stress from the changes required to produce and deliver the new formulation. If the forecasts were not changed but results increased, P&G would be unable to meet demand and could damage relationships with retailers and customers. On the other hand, an overly aggressive forecast would leave manufacturing with excess raw material, workers and inventory. Torres understood that the implications could be even greater. If compaction led to substantial market growth and share gains, then P&G should speed up the planned North America roll-out and look to make the change in all of P&G's markets worldwide. According to Wright, "The data and statistical models don't tell us too much about what will happen, but my gut says that we should increase the forecasts by a few percent." Exhibit 2 P&G Organizational Structure Bob McDonald President & CEO Dimitri Panayotopoulos Vice Chairman, Global Business Units Werner Geissler Vice Chairman, Global Operations Filippo Passerini Group President, GBS & CIO Corporate Accounting 1 Corporate Strategy Beauty & Grooming Household Care North America Global Business Services Western Europe Legal II Employee Services Asia II Accounting Beauty Grooming Health Care Fabric Care and Home Care Baby Care and Family Care IDS Latin America Facilities CEE & MEA Governance Global Business Units (GBUS) Market Development Organizations (MDOS) Global Business Services (GBS) Corporate Functions L
Step by Step Solution
There are 3 Steps involved in it
1 Expert Approved Answer
Step: 1 Unlock

Question Has Been Solved by an Expert!
Get step-by-step solutions from verified subject matter experts
Step: 2 Unlock
Step: 3 Unlock