

Question: need calculation . For your selected factor, calculate the mean, standard deviation, and 5-Number Summary of the Quality variable for each level of that factor.
need calculation
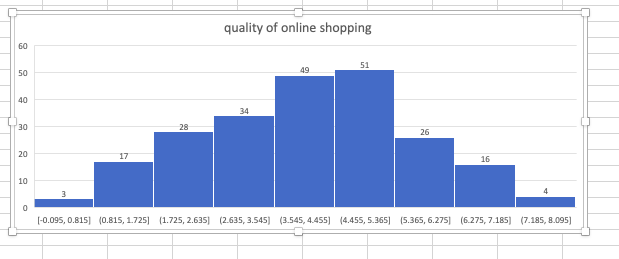
. For your selected factor, calculate the mean, standard deviation, and 5-Number Summary of the Quality variable for each level of that factor. Summarize these values in a small table in your report. If there are associated units with these statistics, include them. If there are not, explain why. Comment on if there are any unusual values. . Using the summary statistics you calculated above, along with the side-by-side boxplot, do you have reason to believe that the mean Quality score is different between the two levels of the factor you selected? Justify your response with a brief explanation, using specific values you have calculated and the boxplot you created\f
Step by Step Solution
There are 3 Steps involved in it

Get step-by-step solutions from verified subject matter experts