

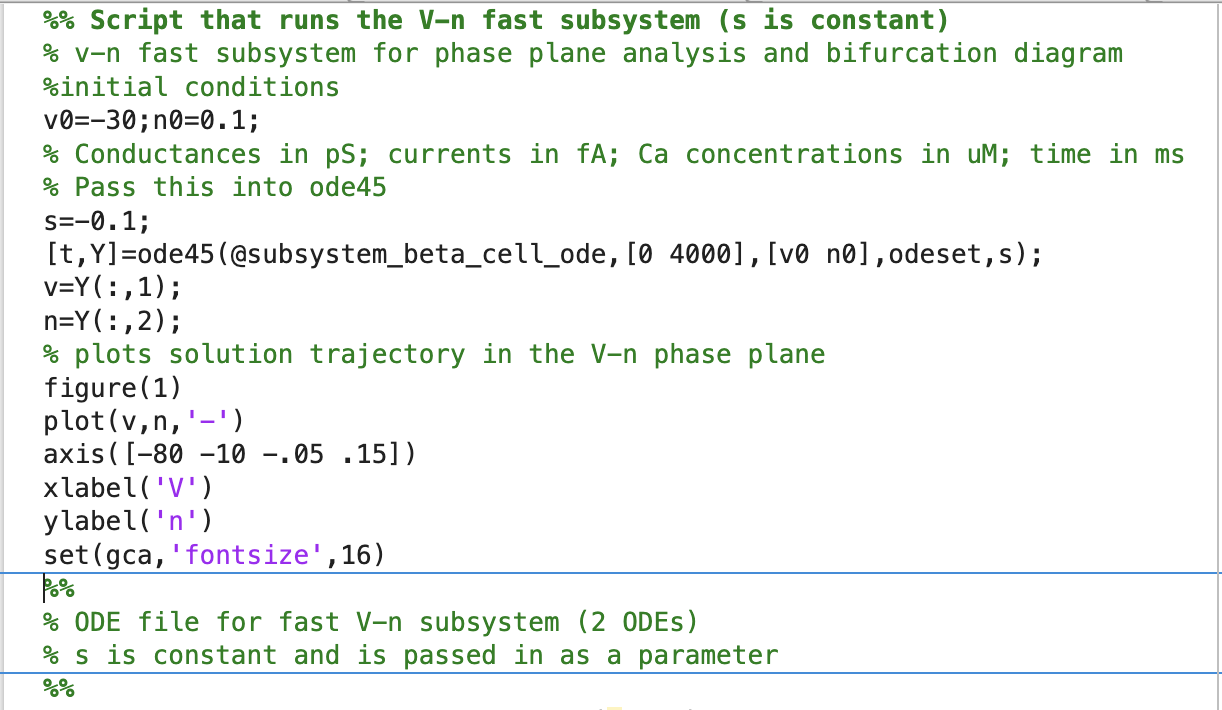
Question: Need Code: How do I fix this code so I can plot the following 3. (Computing) For this problem, start with the files hw5_subsystem_script.m and
Need Code: How do
 I fix this code so I can plot the following
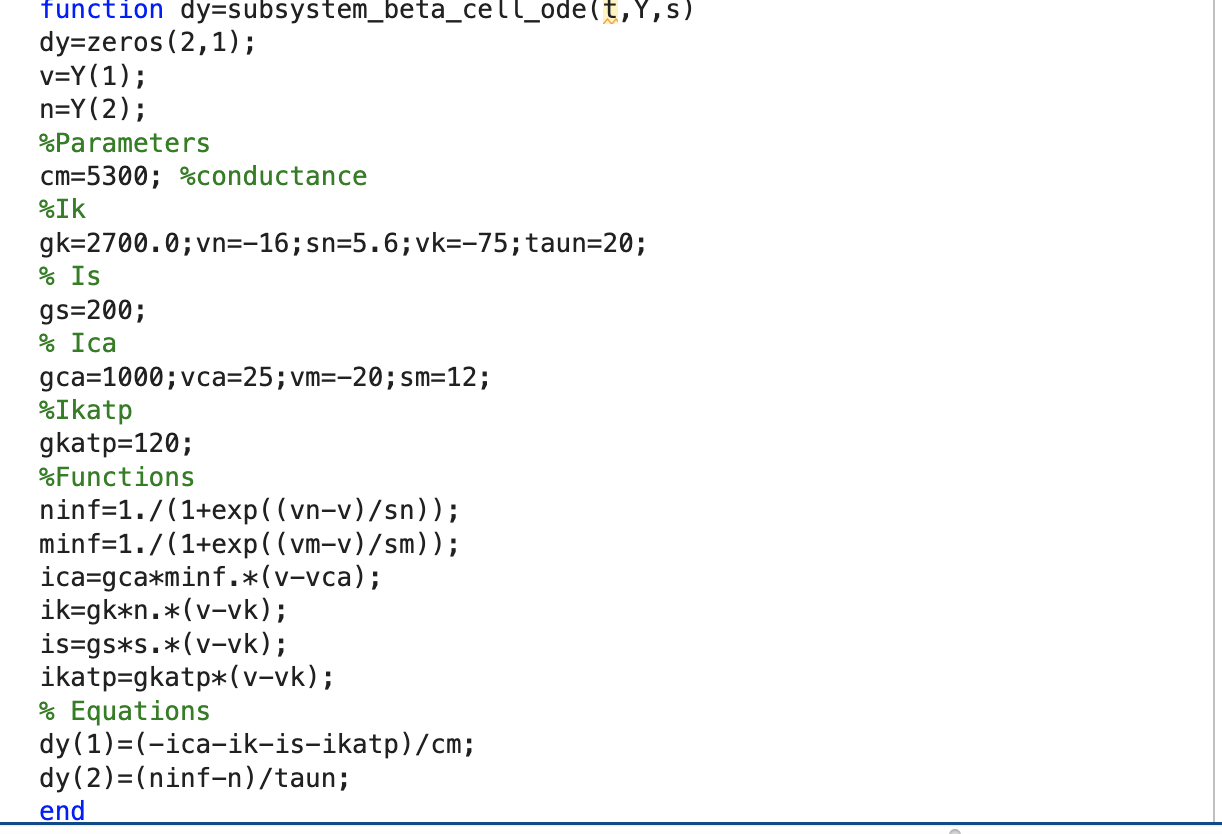
3. (Computing) For this problem, start with the files "hw5_subsystem_script.m" and "subsystem_beta_cell_ode.m, though note that the script file will have to be edited heavily to plot the necessary nullclines. (a) In MATLAB, plot nullclines of the two-dimensional Vn system for s=0.8. In the same plot, graph several solutions, with different initial conditions (using provided files) to explore the stability of the steady state(s). What do you find? Do your findings match the bifurcation diagram we did in class? (b) Repeat part (a) for s=0.2. (c) Repeat part (a) for s=0.4. function dy=subsystem_beta_cell_ode(t,Y,s) dy=zeros (2,1); v=Y(1); n=Y(2); %Parameters cm=5300; \%conductance %Ik gk=2700.0;vn=-16; sn=5.6; vk=-75; taun =20; % Is gs=200; % Ica gca=1000;vca=25;vm=-20; sm=12; %Ikatp gkatp=120; %Functions ninf =1./(1+exp((vnv)/sn)); minf =1./(1+exp((vmv)/sm)); ica=gca*minf.*(v-vca); ik=gk*n. (vvk); is =gss.(vvk); ikatp=gkatp*(v-vk); % Equations dy (1)=(icaikisikatp)/cm; dy (2)=(ninfn)/ taun; end
Step by Step Solution
There are 3 Steps involved in it

Get step-by-step solutions from verified subject matter experts