

Question: Need complete step by steps details and answers for both the queries please for a beginner to learn and understand. Task 1 The following graph
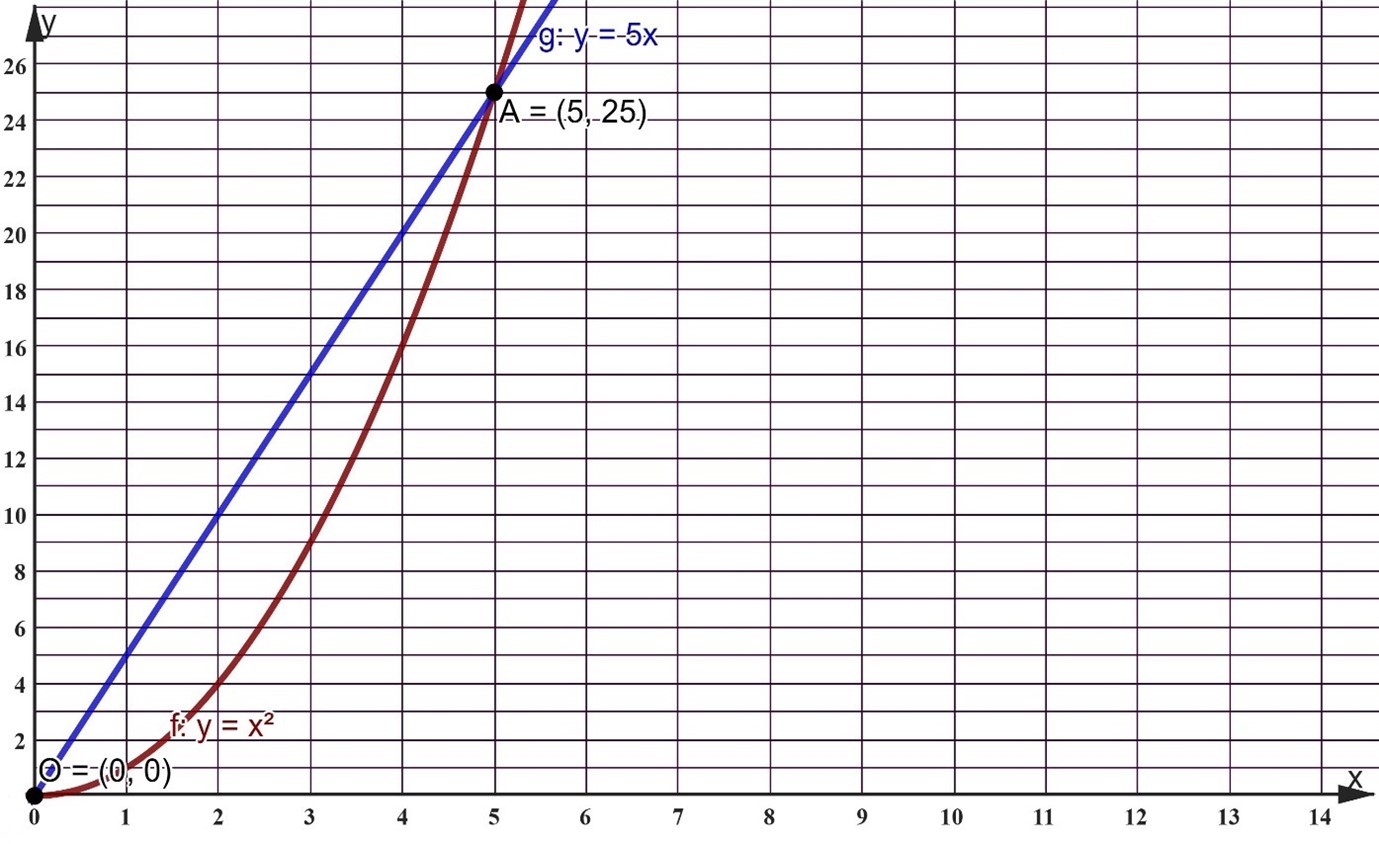
Need complete step by steps details and answers for both the queries please for a beginner to learn and understand. Task 1The following graph (representing f and g) illustrates the relationship between the weights (y in tons) of two animals and their respective lengths (x in feet).
(i) In the event of intersection on the graph, determine the rates of change in length concerning weight for both categories. What conclusions can be drawn from this?
(ii) Select any two points on each of the graphs f and g (designated as C and D on f, and E and F on g, excluding O and A), and calculate the slopes of the lines CD and EF connecting them. What insights can be inferred about their slopes within the context of the problem? Please discuss your findings.
\f\f
Step by Step Solution
There are 3 Steps involved in it

Get step-by-step solutions from verified subject matter experts