

Question: Need correct answers only and answer all 2. Han invests $10,000 into a fund that combines stocks and bonds. The return varies from year to
Need correct answers only and answer all
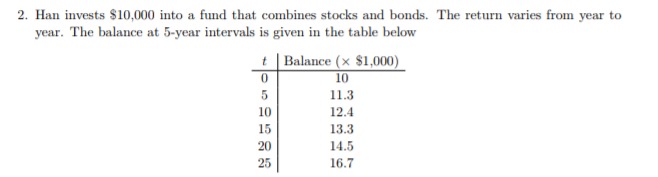
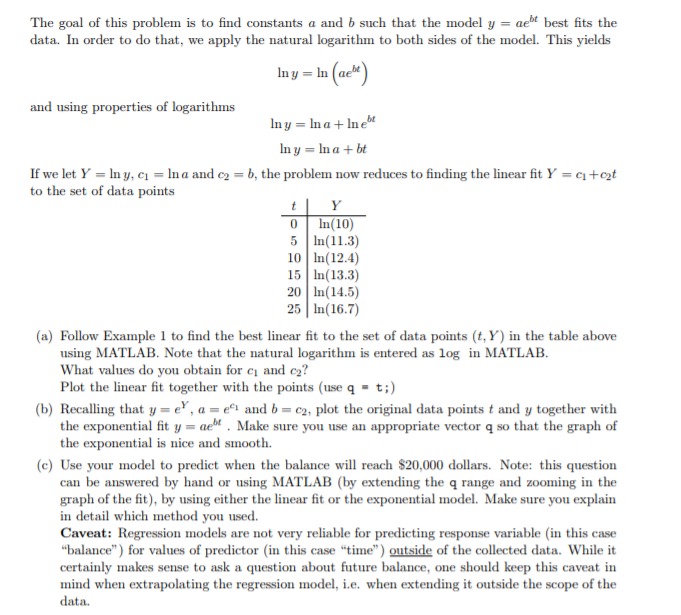
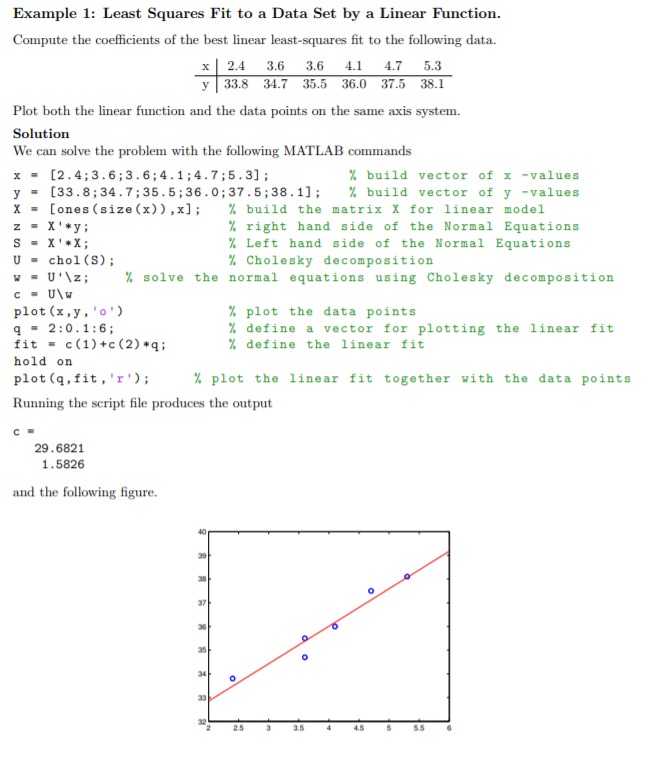
2. Han invests $10,000 into a fund that combines stocks and bonds. The return varies from year to year. The balance at 5-year intervals is given in the table below Balance (x $1,000) 10 11.3 10 12.4 15 13.3 14.5 25 16.7The goal of this problem is to find constants a and b such that the model y = acht best fits the data. In order to do that, we apply the natural logarithm to both sides of the model. This yields Iny = In (aebt ) and using properties of logarithms Iny = Ina+ Inet Iny = Ina + bt If we let Y = Iny, ci = In a and cy = b, the problem now reduces to finding the linear fit Y = c, + cat to the set of data points Y 0 In (10) 5 In (11.3) 10 In(12.4) 15 In(13.3) 20 In (14.5) 25 In (16.7) (a) Follow Example 1 to find the best linear fit to the set of data points (t, Y') in the table above using MATLAB. Note that the natural logarithm is entered as log in MATLAB. What values do you obtain for c and ca? Plot the linear fit together with the points (use q = t;) (b) Recalling that y = el, a = ect and b = cy, plot the original data points t and y together with the exponential fit y = ded . Make sure you use an appropriate vector q so that the graph of the exponential is nice and smooth. (c) Use your model to predict when the balance will reach $20,000 dollars. Note: this question can be answered by hand or using MATLAB (by extending the q range and zooming in the graph of the fit), by using either the linear fit or the exponential model. Make sure you explain in detail which method you used. Caveat: Regression models are not very reliable for predicting response variable (in this case "balance" ) for values of predictor (in this case "time" ) outside of the collected data. While it certainly makes sense to ask a question about future balance, one should keep this caveat in mind when extrapolationg the regression model, i.e. when extending it outside the scope of the data.Example 1: Least Squares Fit to a Data Set by a Linear Function. Compute the coefficients of the best linear least-squares fit to the following data. x 2.4 3.6 3.6 4.1 4.7 5.3 y 33.8 34.7 35.5 36.0 37.5 38.1 Plot both the linear function and the data points on the same axis system. Solution We can solve the problem with the following MATLAB commands = [2 . 4; 3 . 6 ; 3 . 6 ; 4. 1 ; 4. 7 ;5.3] ; % build vector of x -values = [33 . 8 ; 34 . 7 ; 35 . 5 ; 36 . 0 ; 37 . 5 ;38. 1] ; % build vector of y -values X [ones (size (x) ) , x] ; % build the matrix X for linear model Z X ' *y; % right hand side of the Normal Equations X ' * X ; % Left hand side of the Normal Equations U = chol (S) ; % Cholesky decomposition V = U' \\z; % solve the normal equations using Cholesky decomposition c = U\\W plot (x , y, 'o' ) % plot the data points q = 2:0.1:6; % define a vector for plotting the linear fit fit = c(1)+c (2)*q; % define the linear fit hold on plot (q, fit , 'r' ) ; % plot the linear fit together with the data points Running the script file produces the output 29 . 6821 1. 5826 and the following figure. 40 39 38 37 36 2.5 3.5 4.5 5.5
Step by Step Solution
There are 3 Steps involved in it

Get step-by-step solutions from verified subject matter experts