

Question: need correct code to get the output that is shown. pictures are in order from first to last. This homework contains 13 questions, and total
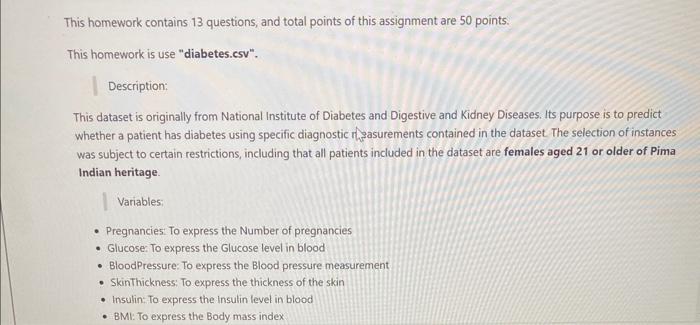
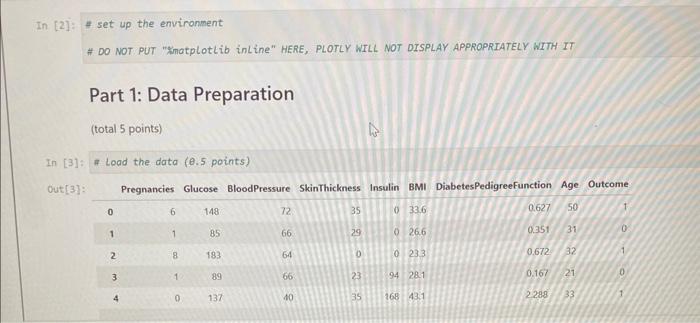
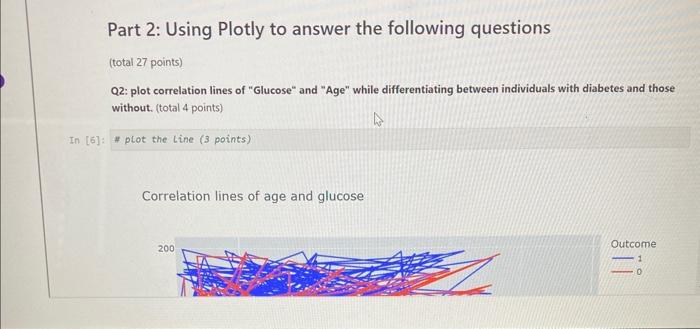
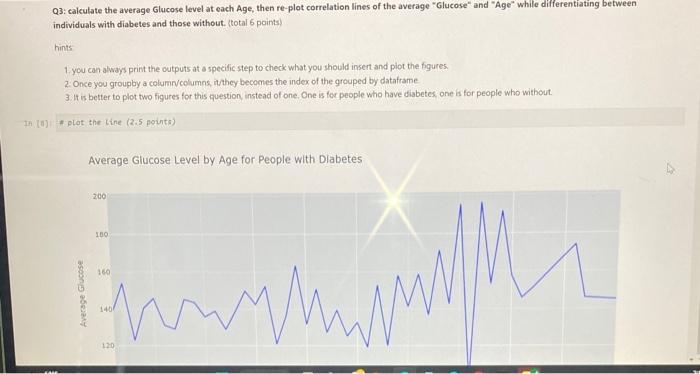
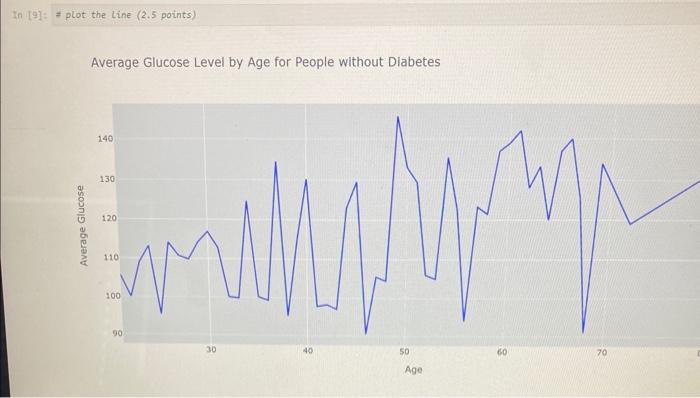
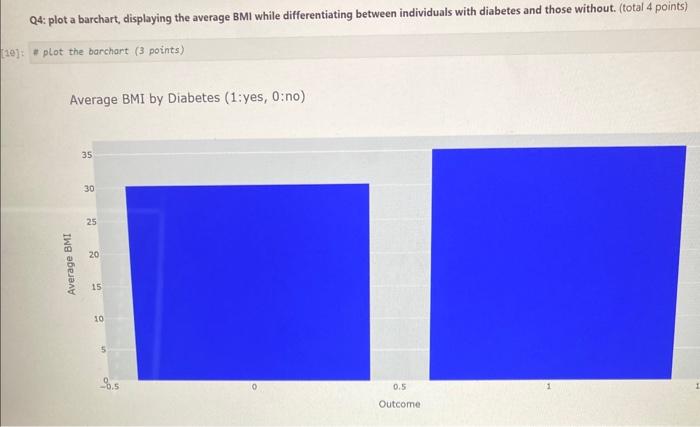
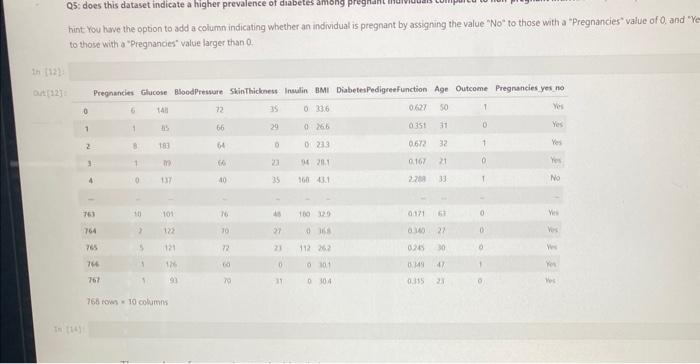
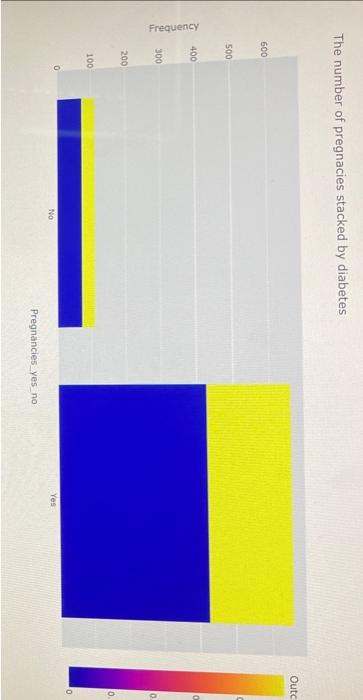
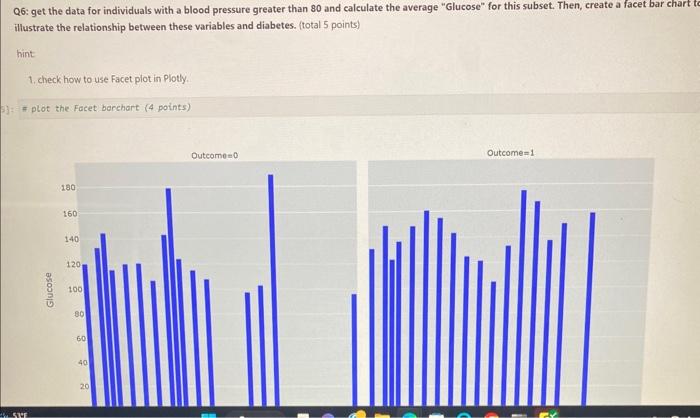
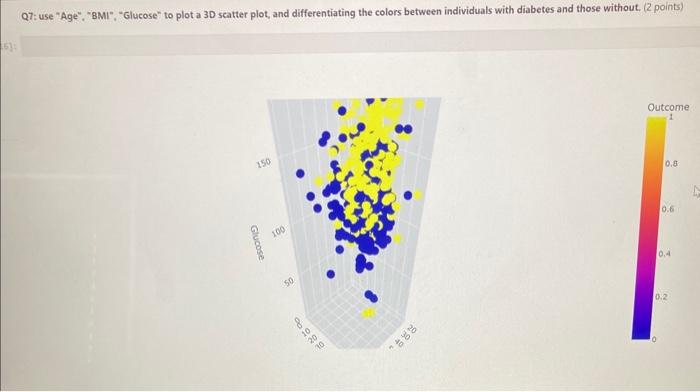
This homework contains 13 questions, and total points of this assignment are 50 points. This homework is use "diabetes.csv". Description: This dataset is originally from National Institute of Diabetes and Digestive and Kidney Diseases. Its purpose is to predict whether a patient has diabetes using specific diagnostic rhasurements contained in the dataset. The selection of instances was subject to certain restrictions, including that all patients included in the dataset are females aged 21 or older of Pima Indian heritage. Variables; - Pregnancies: To express the Number of pregnancies - Glucose: To express the Glucose level in blood - BloodPressure: To express the Blood pressure measurement - Skinthickness: To express the thickness of the skin - Insulin: To express the Insulin level in blood - BML: To express the Body mass index * set up the environment \# DO NOT PUT "Xmatplotlib inLine" HERE, PLOTLY WILL NOT DISPLAY APPROPRIATELY WITH IT Part 1: Data Preparation (total 5 points) [3] Q1: What you can tell from the statistical summary? ( 3.5 points) hint this is a very interesting dataset as most of variables Jre numberic variables, please Google how to inteprete the values from statistical summay. [Type your answer] Q2: plot correlation lines of "Glucose" and "Age" while differentiating between individuals with diabetes and those without. (total 4 points) H plot the line ( 3 points) Correlation lines of age and glucose Q3: calculate the average Glucose level at each Age, then re-plot correlation lines of the average "Glucose" and "Age" while differentiating between individuals with diabetes and those without. (total 6 points) hints 1 you can always print the outputs at a specific step to check what you should insert and plot the figures. 2. Once you groupby a column/columns, itthey becomes the index of the grouped by datatrame 3. It is better to plot two figures for this question instead of one. One is for people who have diabetes one is for people who without. 1) + plot the tine (2.5 points) Average Glucose Level by Age for People with Dlabetes Average Glucose Level by Age for People without Diabetes Q4: plot a barchart, displaying the average BMI while differentiating between individuals with diabetes and those without. (total 4 points) "plot the barchart (3 points) Average BMI by Diabetes ( 1 :yes, 0: no) hint You have the option to add a column indicating whether an individual is pregnant by assigning the value "No" to those with a "Pregnancies" value of 0 . and " to those with a "Pregnancies" value larger than 0 . The number of pregnacies stacked by diabetes Q6: get the data for individuals with a blood pressure greater than 80 and calculate the average "Glucose" for this subset. Then, create a facet bar chart t illustrate the relationship between these variables and diabetes. (total 5 points) hint 1. check how to use Facet plot in Plotly. 1: \# plot the Facet barchart ( 4 points) Q7: use "Age", "BMI". "Glucose" to plot a 30 scatter plot, and differentiating the colors between individuals with diabetes and those without. (2 points)
Step by Step Solution
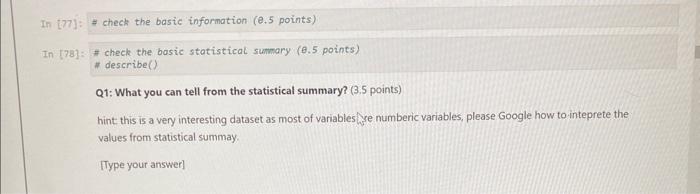
There are 3 Steps involved in it

Get step-by-step solutions from verified subject matter experts