

Question: need explanations how to do this task 2015 $ 29,393 85, 191 108. 162 9.466 256, 213 $ 488,425 $ 34,358 5 9,537 76,337 8.842
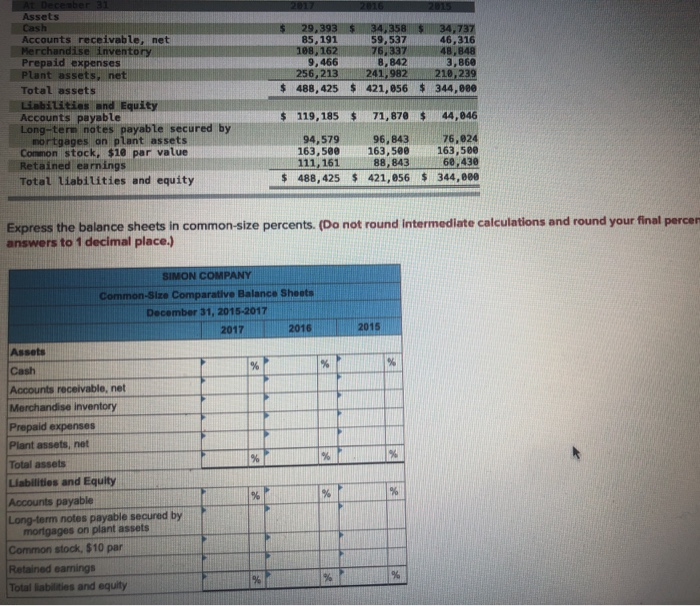
2015 $ 29,393 85, 191 108. 162 9.466 256, 213 $ 488,425 $ 34,358 5 9,537 76,337 8.842 241,982 $ 421,856 34,737 46,316 48 848 3,860 210,239 $ 344,080 Assets Cash Accounts receivable, net Merchandise inventory Prepaid expenses plant assets, net Total assets Liabilities and Equity Accounts payable Long-term notes payable secured by mortgages on plant assets Common stock, $10 par value Retained earnings Total liabilities and equity $ 119, 185 $ 71,870 $ 44,046 94,579 163,500 111, 161 $ 488,425 9 6, 843 163,500 88,843 $ 421,056 76,024 163,500 60 430 $ 344,000 Express the balance sheets in common-size percents. (Do not round Intermediate calculations and round your final percer answers to 1 decimal place.) SIMON COMPAN Common-Size Comparative Balance Sheets December 31, 2015-2017 2017 2016 2015 Accounts receivable, net Merchandise inventory Prepaid expenses Plant assets, nel Total assets Liabilities and Equity Accounts payable Long-term notes payable secured by mortgages on plant assets Common stock. $10 par Retained earnings Total liabilities and equity
Step by Step Solution
There are 3 Steps involved in it

Get step-by-step solutions from verified subject matter experts