

Question: Need Formulas shown for problem 100% Q- Search in Sheet A Home Layout Tables DE 25 Y= fx Charts SmartArt Formulas Data External Data Sources
 Need Formulas shown for problem
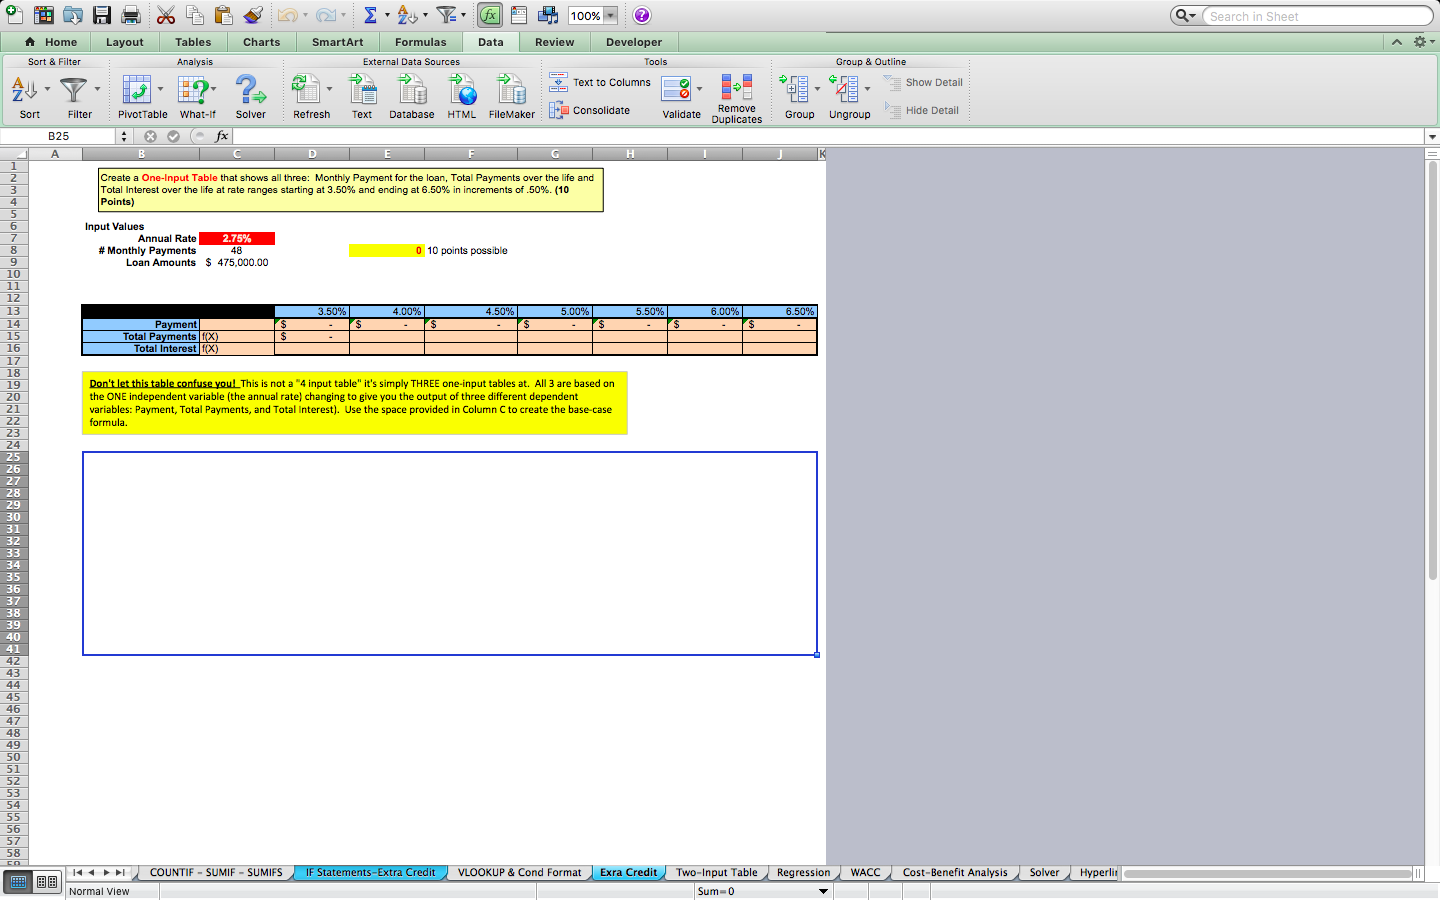
100% Q- Search in Sheet A Home Layout Tables DE 25 Y= fx Charts SmartArt Formulas Data External Data Sources Review Developer Tools Sort & Filter Analysis Group & Outline re Show Detail , Text to Columns + Sort Filter Pivot Table What if Solver Refresh Text Database HTML FileMaker Consolidate Validate Remove Duplicates PE Hide Detail Group Ungroup B25 + fx % B D E F H 1 Create a One-Input Table that shows all three: Monthly Payment for the loan, Total Payments over the life and Total Interest over the life at rate ranges starting at 3.50% and ending at 6.50% in increments of 50%. (10 Points) Input Values Annual Rate 2.75% # Monthly Payments 48 Loan Amounts $ 475,000.00 0 10 points possible 4.00% 5.00% 6.50% 3.50% $ 4.50% $ 5.50% $ 6.00% $ $ $ $ Payment Total Payments f(x) Total Interest f(x) Don't let this table confuse you! This is not a "4 input table" it's simply THREE one-input tables at. All 3 are based on the ONE independent variable (the annual rate) changing to give you the output of three different dependent variables: Payment, Total Payments, and Total Interest). Use the space provided in Column C to create the base-case formula 1 2 3 4 5 5. 6 7 8 9 10 11 12 13 14 15 16 17 18 19 20 21 22 23 24 25 26 27 28 29 30 31 32 33 34 35 36 37 38 39 40 41 42 43 44 45 46 47 48 49 50 51 52 53 54 55 56 57 58 CO COUNTIF - SUMIF - SUMIFS IF Statements-Extra Credit VLOOKUP & Cond Format Regression WACC Cost-Benefit Analysis Solver Hyperlit 200 RRRR Exra Credit Two-Input Table Sum-0 Normal View
Step by Step Solution
There are 3 Steps involved in it

Get step-by-step solutions from verified subject matter experts