

Question: Need full explanation please Square Corp. Square Corp. Income Statement Balance Sheet For the Year Ended Dec. 31, 2017 ($ in 000's) As of Dec.
Need full explanation please 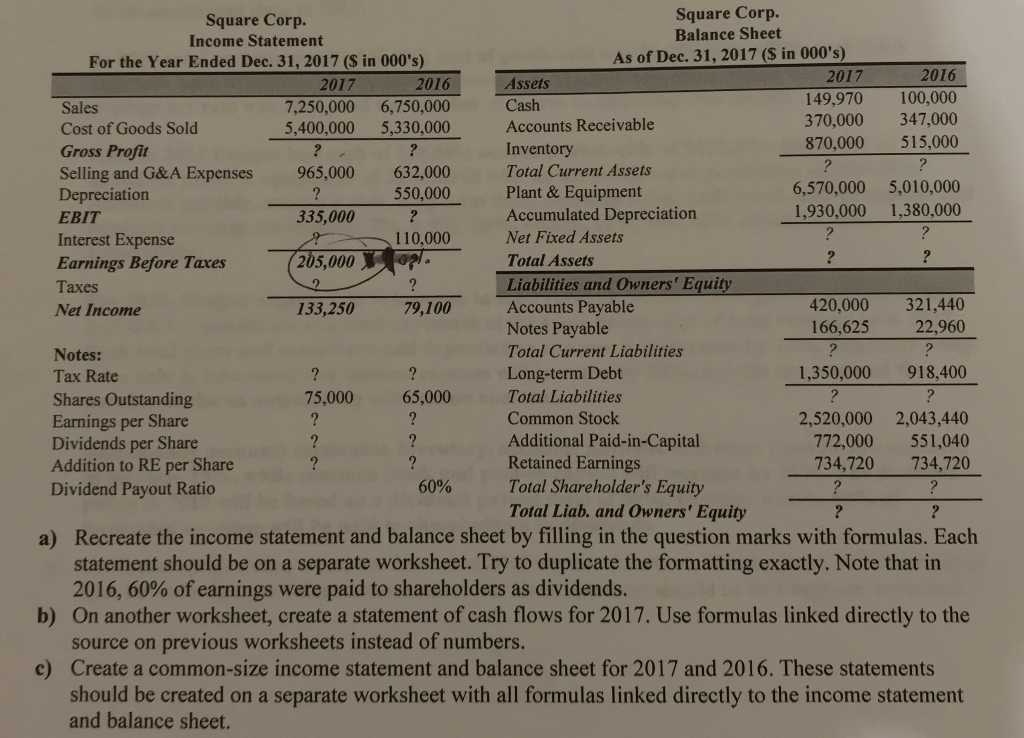
Square Corp. Square Corp. Income Statement Balance Sheet For the Year Ended Dec. 31, 2017 ($ in 000's) As of Dec. 31, 2017 ($ in 000's) 2017 2016 Assets 2017 2016 Sales 7,250,000 6,750,000 Cash 149,970 100,000 Cost of Goods Sold 5,400,000 5,330,000 Accounts Receivable 370,000 347,000 Gross Profit Inventory 870,000 515,000 Selling and G&A Expenses 965,000 632,000 Total Current Assets Depreciation ? 550,000 Plant & Equipment 6,570,000 5,010,000 EBIT 335,000 Accumulated Depreciation 1,930,000 1,380,000 Interest Expense 110,000 Net Fixed Assets Earnings Before Taxes (205,000 0 . Total Assets Taxes Liabilities and Owners' Equity Net Income 133,250 79,100 Accounts Payable 420,000 321,440 Notes Payable 166,625 22,960 Notes: Total Current Liabilities Tax Rate Long-term Debt 1,350,000 918,400 Shares Outstanding 75,000 65,000 Total Liabilities Earnings per Share Common Stock 2,520,000 2,043,440 Dividends per Share Additional Paid-in-Capital 772,000 551,040 Addition to RE per Share Retained Earnings 734,720 734,720 Dividend Payout Ratio 60% Total Shareholder's Equity ? ? Total Liab. and Owners' Equity a) Recreate the income statement and balance sheet by filling in the question marks with formulas. Each statement should be on a separate worksheet. Try to duplicate the formatting exactly. Note that in 2016, 60% of earnings were paid to shareholders as dividends. b) On another worksheet, create a statement of cash flows for 2017. Use formulas linked directly to the source on previous worksheets instead of numbers. c) Create a common-size income statement and balance sheet for 2017 and 2016. These statements should be created on a separate worksheet with all formulas linked directly to the income statement and balance sheet. Square Corp. Square Corp. Income Statement Balance Sheet For the Year Ended Dec. 31, 2017 ($ in 000's) As of Dec. 31, 2017 ($ in 000's) 2017 2016 Assets 2017 2016 Sales 7,250,000 6,750,000 Cash 149,970 100,000 Cost of Goods Sold 5,400,000 5,330,000 Accounts Receivable 370,000 347,000 Gross Profit Inventory 870,000 515,000 Selling and G&A Expenses 965,000 632,000 Total Current Assets Depreciation ? 550,000 Plant & Equipment 6,570,000 5,010,000 EBIT 335,000 Accumulated Depreciation 1,930,000 1,380,000 Interest Expense 110,000 Net Fixed Assets Earnings Before Taxes (205,000 0 . Total Assets Taxes Liabilities and Owners' Equity Net Income 133,250 79,100 Accounts Payable 420,000 321,440 Notes Payable 166,625 22,960 Notes: Total Current Liabilities Tax Rate Long-term Debt 1,350,000 918,400 Shares Outstanding 75,000 65,000 Total Liabilities Earnings per Share Common Stock 2,520,000 2,043,440 Dividends per Share Additional Paid-in-Capital 772,000 551,040 Addition to RE per Share Retained Earnings 734,720 734,720 Dividend Payout Ratio 60% Total Shareholder's Equity ? ? Total Liab. and Owners' Equity a) Recreate the income statement and balance sheet by filling in the question marks with formulas. Each statement should be on a separate worksheet. Try to duplicate the formatting exactly. Note that in 2016, 60% of earnings were paid to shareholders as dividends. b) On another worksheet, create a statement of cash flows for 2017. Use formulas linked directly to the source on previous worksheets instead of numbers. c) Create a common-size income statement and balance sheet for 2017 and 2016. These statements should be created on a separate worksheet with all formulas linked directly to the income statement and balance sheet
Step by Step Solution
There are 3 Steps involved in it

Get step-by-step solutions from verified subject matter experts