

Question: need Graph as well not only solutions . Problem 2 Ha Peppas! Pizzeria wants to determine the Break-even point of its new oven by calculating
need Graph as well not only solutions .
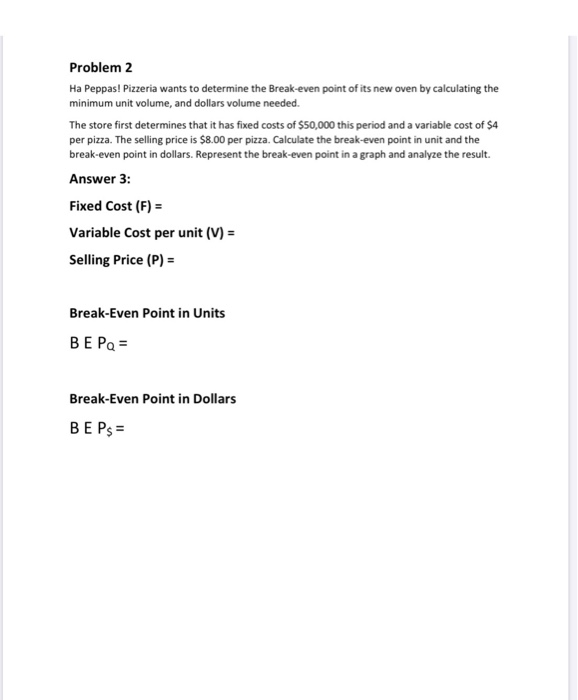
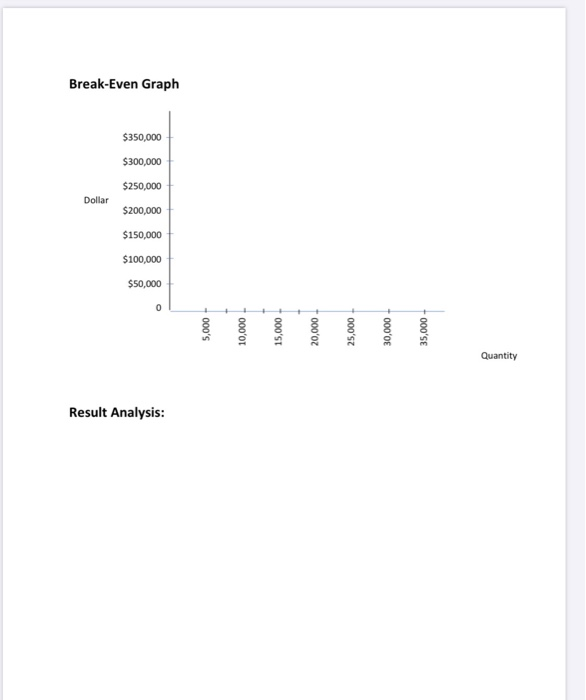
Problem 2 Ha Peppas! Pizzeria wants to determine the Break-even point of its new oven by calculating the minimum unit volume, and dollars volume needed. The store first determines that it has fixed costs of $50,000 this period and a variable cost of $4 per pizza. The selling price is $8.00 per pizza. Calculate the break-even point in unit and the break-even point in dollars. Represent the break-even point in a graph and analyze the result. Answer 3: Fixed Cost (F) = Variable Cost per unit (V) = Selling Price (P) = Break-Even Point in Units BE PQ= Break-Even Point in Dollars BE Ps = Break-Even Graph $350,000 $300,000 $250,000 Dollar $200,000 $150,000 $100,000 $50,000 5,000 10,000 000'st + ooo'oz 25,000 +000'OE 35,000 Quantity Result Analysis
Step by Step Solution
There are 3 Steps involved in it
1 Expert Approved Answer
Step: 1 Unlock

Question Has Been Solved by an Expert!
Get step-by-step solutions from verified subject matter experts
Step: 2 Unlock
Step: 3 Unlock