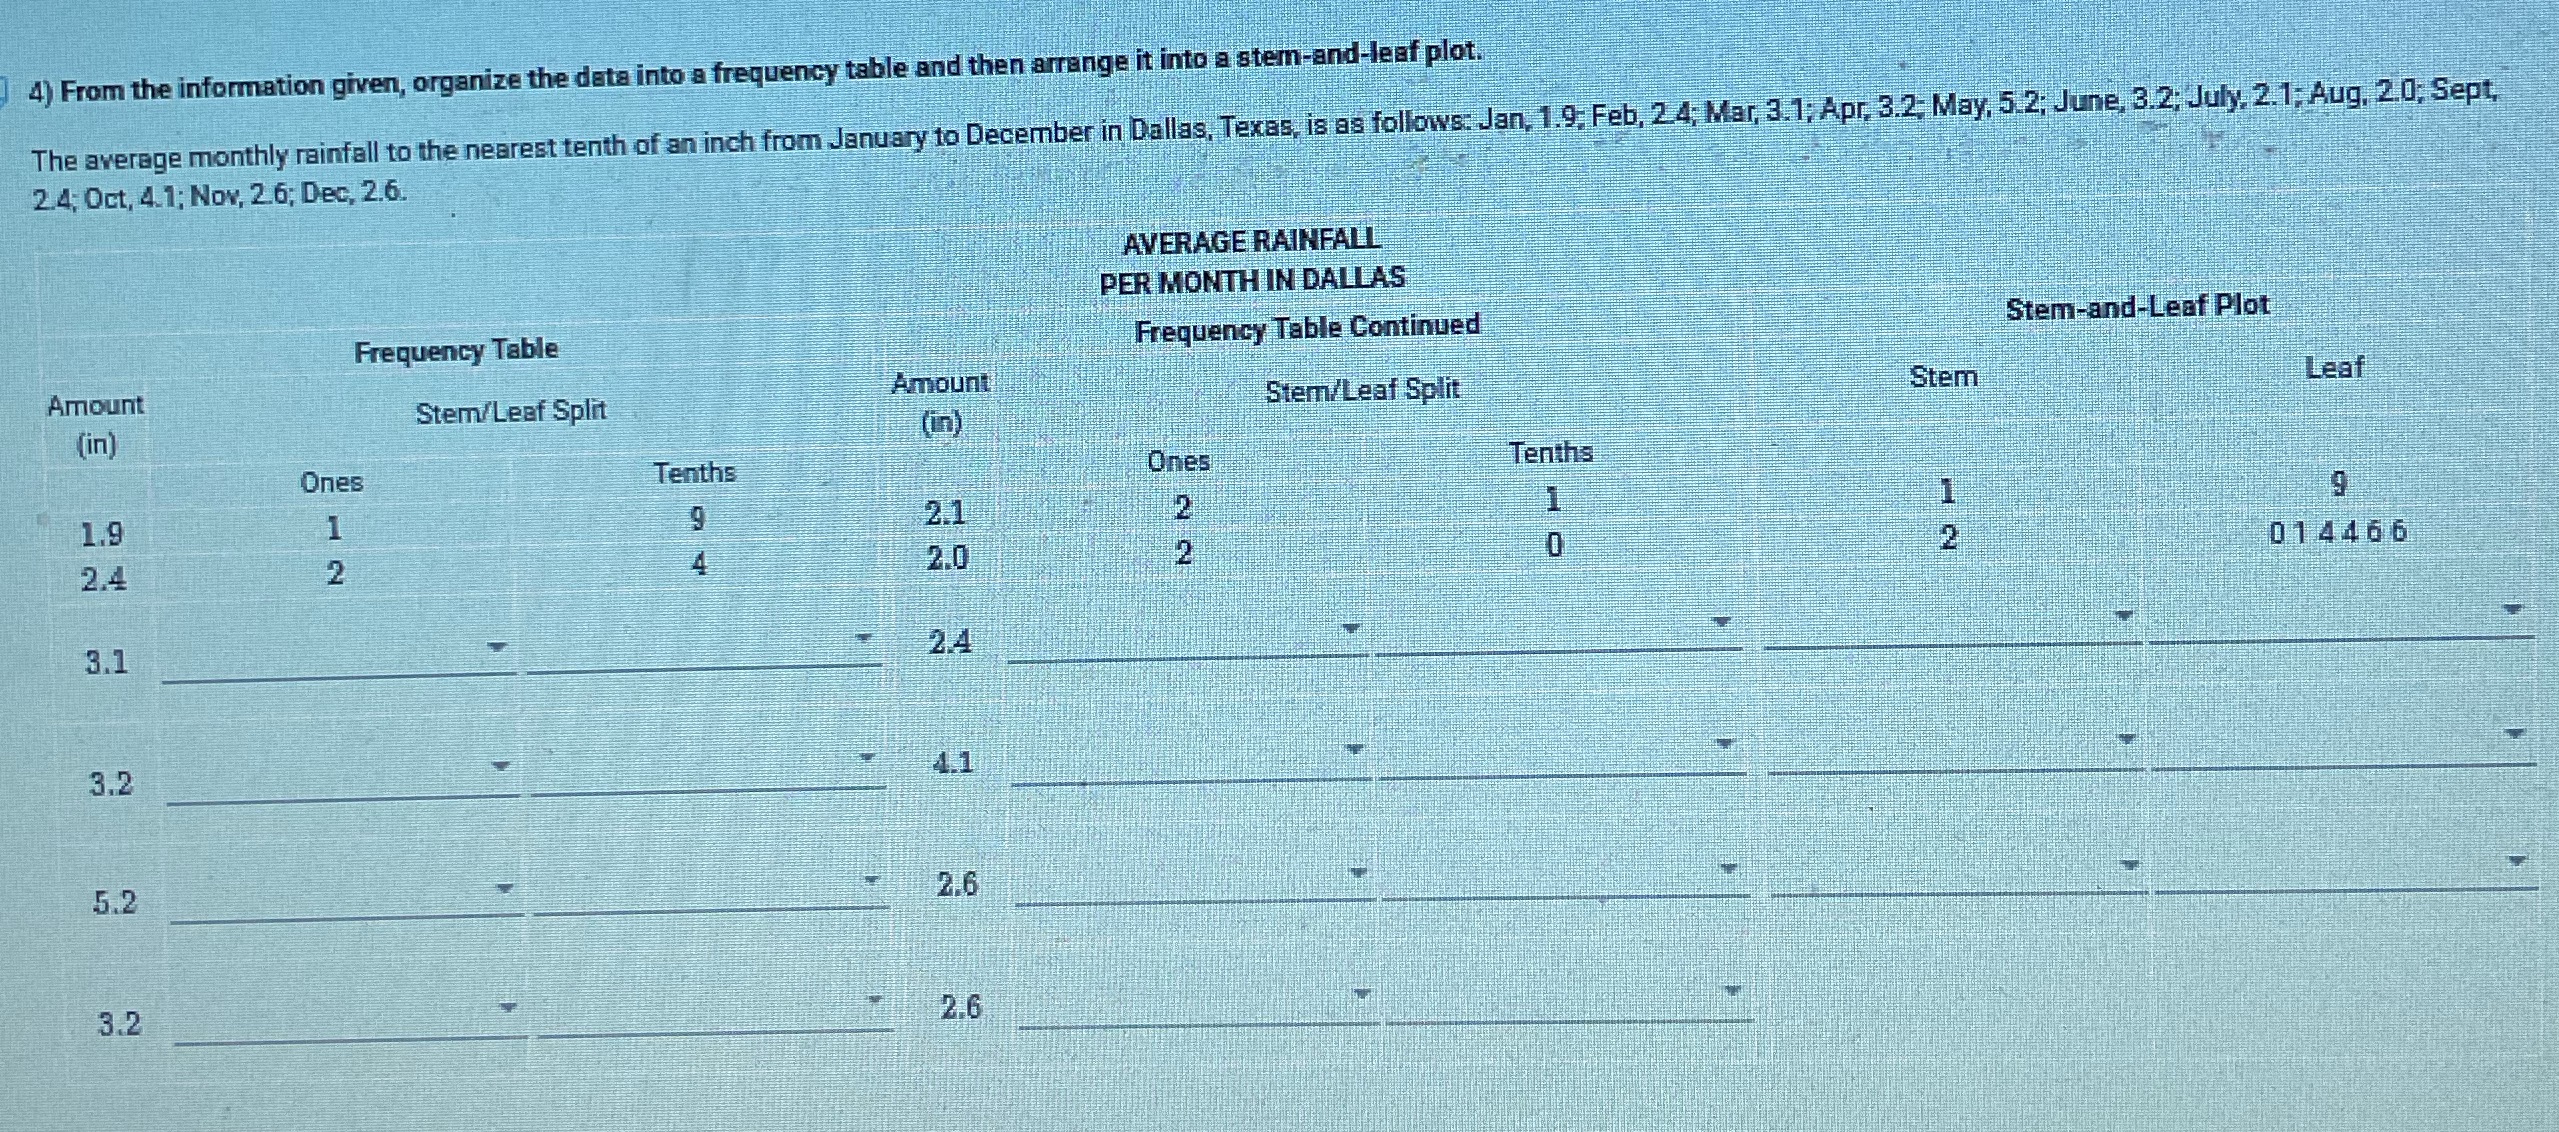
Question: Need help 4) From the information given, organize the data into a frequency table and then arrange it into a stem-and-leaf plot. The average monthly

Need help

Need help 4) From the information given, organize
4) From the information given, organize the data into a frequency table and then arrange it into a stem-and-leaf plot. The average monthly rainfall to the nearest tenth of an inch from January to December in Dallas, Texas, is as follows: Jan, 1.9: Feb, 2.4; Mar, 3.1; Apr. 3.2: May, 5.2; June, 3.2: July. 2.1; Aug, 2.0; Sept, 2.4; Oct, 4.1; Nov, 2.6; Dec, 2.6. AVERAGE RAINFALL PER MONTH IN DALLAS Frequency Table Frequency Table Continued Stem-and-Leaf Plot Amount Amount Stem/Leaf Split Stem/Leaf Split Stem Leaf (in) (in) Ones Tenths Ones Tenths 1.9 2.1 9 2.4 2.0 014466 3.1 2.4 3.2 4.1 5.2 2.6 3.2 2.6

Step by Step Solution

There are 3 Steps involved in it

1 Expert Approved Answer
Step: 1 Unlock blur-text-image
Question Has Been Solved by an Expert!

Get step-by-step solutions from verified subject matter experts

Step: 2 Unlock
Step: 3 Unlock

Students Have Also Explored These Related Mathematics Questions!